Microsoft (MSFT) arguably ranks among the most disappointing tech sector names, with MSFT stock slipping more than 3% over renewed tariff fears. Thanks in part to the latest political shock, MSFT is down roughly 21% since the beginning of the year, demonstrating that while innovations such as artificial intelligence can help lift valuations, investors will only tolerate a certain premium over perceived intrinsic value.
Even though Microsoft is one of the leaders in machine learning thanks to its partnership with OpenAI, the heralded tech giant doesn’t have a whole lot to show for it. Over the past 52 weeks, MSFT stock is down 5%. However, amid the carnage, the security did something extremely rare: it posted five consecutive weeks of red weekly candlesticks.
How rare are we talking about? Based on a binary discretization of price action going back to January 2019, there have been no instances of MSFT stock printing five consecutive down weeks. Since January 2009, there have been seven instances on a rolling basis, meaning that independently, the sample size could be smaller, perhaps three or four occurrences.
Why is this significant beyond just being a statistical anomaly? MSFT stock just happened to trigger Monday’s list of unusual options activity, with some of the biggest transactions carrying neutral to slightly bullish implications. Coincidentally, options flow — which focuses exclusively on big block transactions likely placed by institutional investors — showed net trade sentiment hit nearly $56.2 million above parity, thus favoring the bulls.
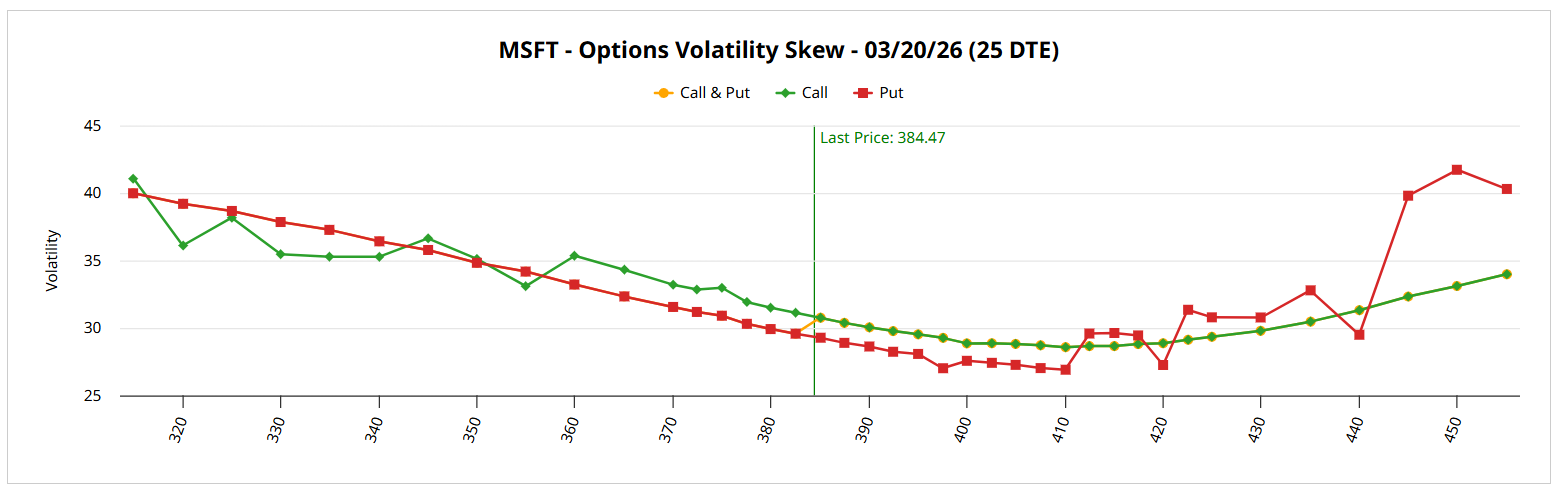
For me, the biggest signal comes from volatility skew. A screener that identifies surface-area distortions of volatility space, the skew provides a visual indicator of the positional bias of smart money traders. Think of the skew in American football terms. If an offensive formation features more skill players on a particular side, that region becomes the strong side.
In the case of MSFT’s March 20 expiration date, the skew swings upward to the left, potentially indicating prioritization of downside protection. However, the rise in the skew is controlled, meaning no unusual urgency. On the right side, the skew (for calls) also rises modestly, indicating a positioning for possible upside expression.
Establishing the Trading Parameters of MSFT Stock
While we now have a basic framework of the possible sentiment bias of the smart money, we need to translate this data into tangible price forecasts. After all, we can’t trade on sentiment as we eventually must settle on a specific wager. For this exercise, we may turn to the Expected Move calculator. For the March 20 expiration date, the projected dispersion comes out to $364.11 and $404.83.
Where does this dispersion come from? Conceptually, the derivatives sector very much operates like an insurance market. When traders buy calls and puts, they’re effectively paying premiums based on how much movement they think is realistically possible over a specific time window. Therefore, the higher the perceived risk of movement, the more expensive the insurance.
Let’s say you take those insurance prices and reverse-engineer what kind of movement they’re implying. Following this exercise, you get a range or the market’s consensus estimate of how far the target security is likely to travel by a certain date.
If you want the cheat sheet version, the above dispersion on the aforementioned expiration date represents the range of outcomes we would expect in 68% of cases. It’s a very good benchmark, as the underlying algorithm essentially represents Wall Street’s standard barometer for pricing options.
However, our job as analysts is not to repeat back these calculations. Instead, if we grant the presupposition that our target security will likely fall within the Expected Move calculator’s projected dispersion, we must then interrogate, to the best of our ability, where we think the security may actually land.
If you’re on a search-and-rescue (SAR) mission, you wouldn’t tell your commanding officer that the shipwrecked survivor is “somewhere here” while drawing a big circle with your hand. In the same vein, we need to try to pinpoint where in the dispersion MSFT stock is likely to lurk.
Considering Additional Data to Filter Down Noise
Earlier, I mentioned that MSFT stock flashed a rare signal, printing five consecutive red weekly candlesticks. Historically, this sequence tends to resolve higher, which is why I believe the positive unusual options activity and options flow data are significant. As well, volatility skew shows a positioning for upside convexity.
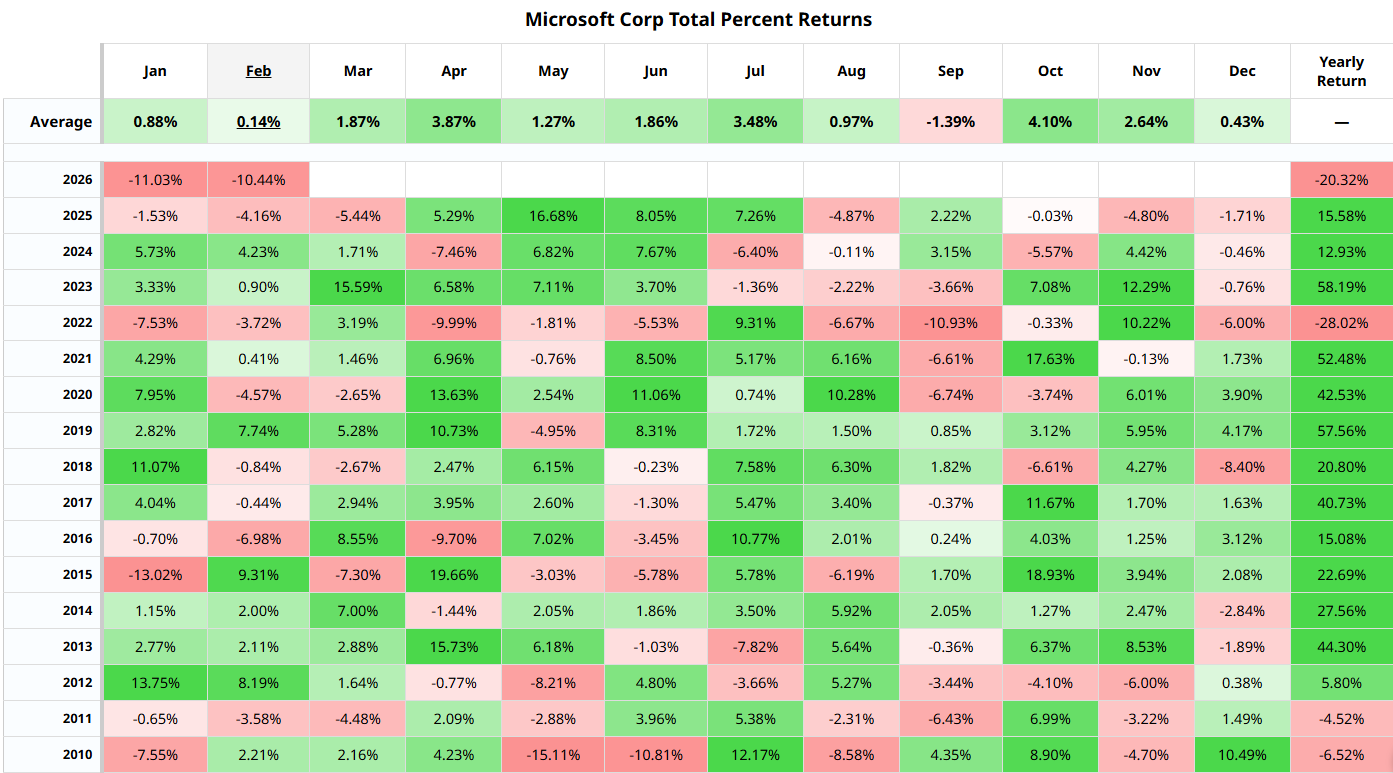
Even without that statistical knowledge, we can also turn to Barchart’s Seasonal Returns heatmap. Here, we discover that March tends to be one of the solid-performing months of the year, with an average return of 1.87%. On positive iterations, we’re looking at an average performance of 4.76%.
Based on this intel, I’m tempted by the 395/400 bull call spread expiring March 20. If MSFT stock rises through the $400 strike at expiration, the maximum payout would be over 156%. Breakeven lands at a nickel short of $397, which is a 3.25% gap from Monday’s close.
On the date of publication, Josh Enomoto did not have (either directly or indirectly) positions in any of the securities mentioned in this article. All information and data in this article is solely for informational purposes. For more information please view the Barchart Disclosure Policy here.
More news from Barchart
- Microsoft Stock Just Flashed an Ultra-Rare Bullish Signal for Options Traders
- Buying In-the-Money Palantir Calls Looks Attractive Here for Value Buyers
- Are the Best Days Over for IBM Stock? What Price Volatility Tells Us and How You Can Trade IBM Now.
- The Smart Way to Bet Against Snowflake Stock Before Earnings on February 25


