
Home-building design and manufacturing company Masco Corporation (NYSE: MAS) missed Wall Street’s revenue expectations in Q2 CY2026, with sales falling 2.9% year on year to $1.99 billion. Its non-GAAP profit of $1.64 per share was 25.1% above analysts’ consensus estimates.
Is now the time to buy Masco? Find out by accessing our full research report, it’s free.
Masco (MAS) Q2 CY2026 Highlights:
- Revenue: $1.99 billion vs analyst estimates of $2.08 billion (2.9% year-on-year decline, 4.2% miss)
- Adjusted EPS: $1.64 vs analyst estimates of $1.31 (25.1% beat)
- Adjusted EBITDA: $520 million vs analyst estimates of $441.4 million (26.1% margin, 17.8% beat)
- Management raised its full-year Adjusted EPS guidance to $4.50 at the midpoint, a 7.1% increase
- Operating Margin: 23.6%, up from 20.1% in the same quarter last year
- Free Cash Flow Margin: 22.7%, up from 13.2% in the same quarter last year
- Market Capitalization: $16.19 billion
“We have executed well in the first half of the year,” said Masco’s President and CEO, Jon Nudi.
Company Overview
Headquartered just outside of Detroit, MI, Masco (NYSE: MAS) designs and manufactures home-building products such as glass shower doors, decorative lighting, bathtubs, and faucets.
Revenue Growth
Reviewing a company’s long-term sales performance reveals insights into its quality. Any business can put up a good quarter or two, but many enduring ones grow for years. Unfortunately, Masco struggled to consistently increase demand as its $7.62 billion of sales for the trailing 12 months was close to its revenue five years ago. This wasn’t a great result and suggests it’s a low quality business.
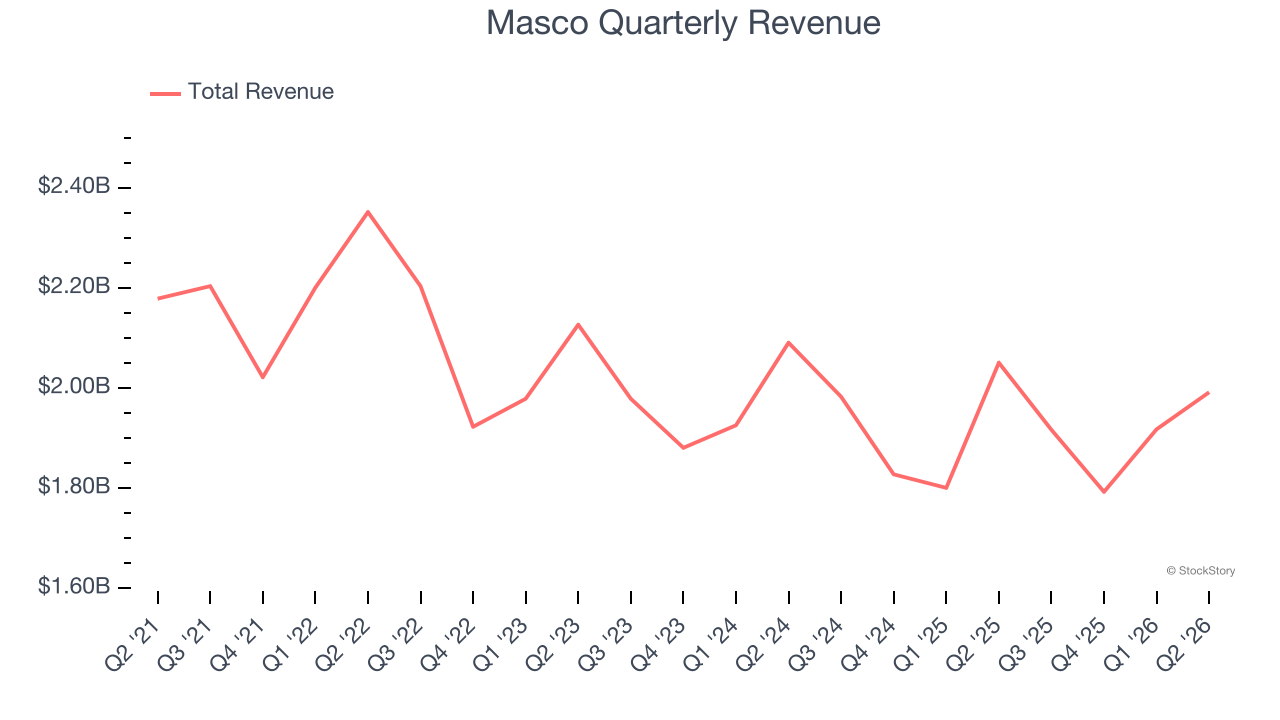
Long-term growth is the most important, but within industrials, a half-decade historical view may miss new industry trends or demand cycles. Masco’s annualized revenue declines of 1.6% over the last two years align with its five-year trend, suggesting its demand has consistently shrunk. 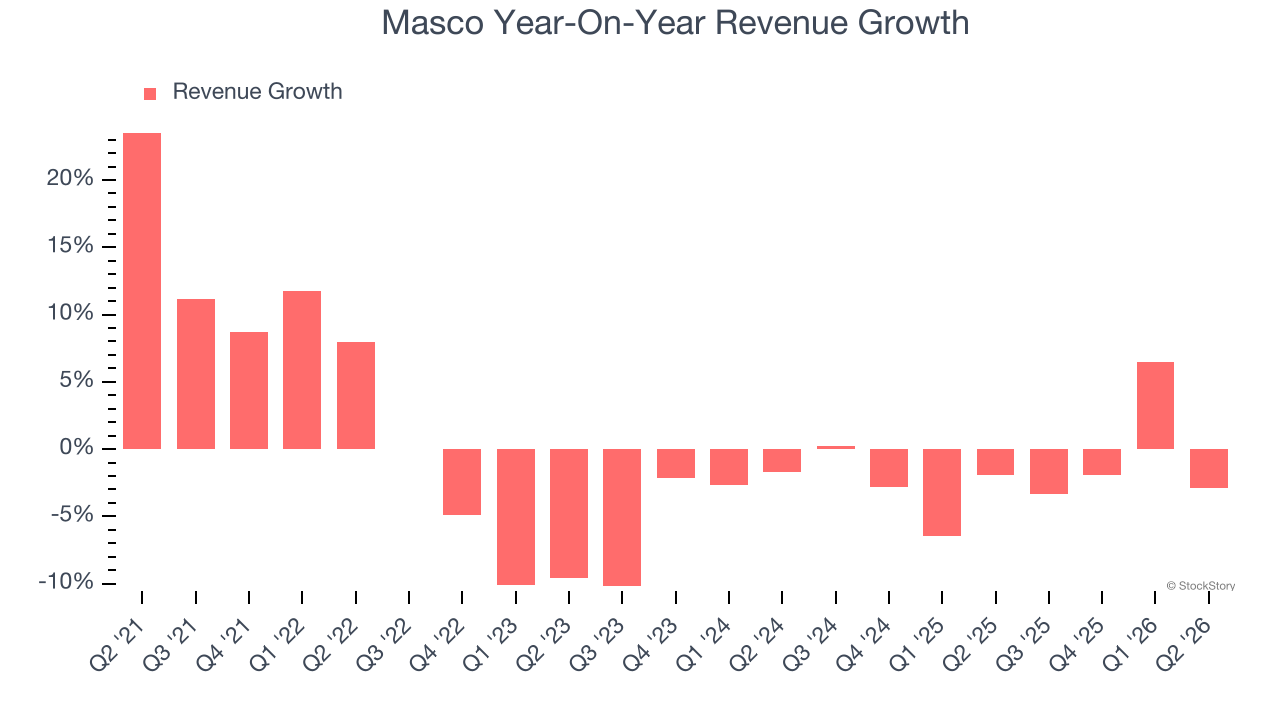
This quarter, Masco missed Wall Street’s estimates and reported a rather uninspiring 2.9% year-on-year revenue decline, generating $1.99 billion of revenue.
Looking ahead, sell-side analysts expect revenue to grow 3.4% over the next 12 months. Although this projection implies its newer products and services will spur better top-line performance, it is still below the sector average.
ONE MORE THING: 3 Hidden Platforms Growing 3X Faster than Amazon, Google, and PayPal. Amazon, Google, and Meta all followed the same playbook: Dominate an ignored market. Build an unbeatable moat. Scale until you’re unstoppable.
These three platforms are running that exact playbook right now. The early investors in Amazon made fortunes. The early investors in these could do the same. Get All 3 Stocks Here for FREE.
Operating Margin
Operating margin is an important measure of profitability as it shows the portion of revenue left after accounting for all core expenses — everything from the cost of goods sold to advertising and wages. It’s also useful for comparing profitability across companies with different levels of debt and tax rates because it excludes interest and taxes.
Masco has been a well-oiled machine over the last five years. It demonstrated elite profitability for an industrials business, boasting an average operating margin of 16.5%. This result isn’t too surprising as its gross margin gives it a favorable starting point.
Looking at the trend in its profitability, Masco’s operating margin rose by 2 percentage points over the last five years, showing its efficiency has improved.
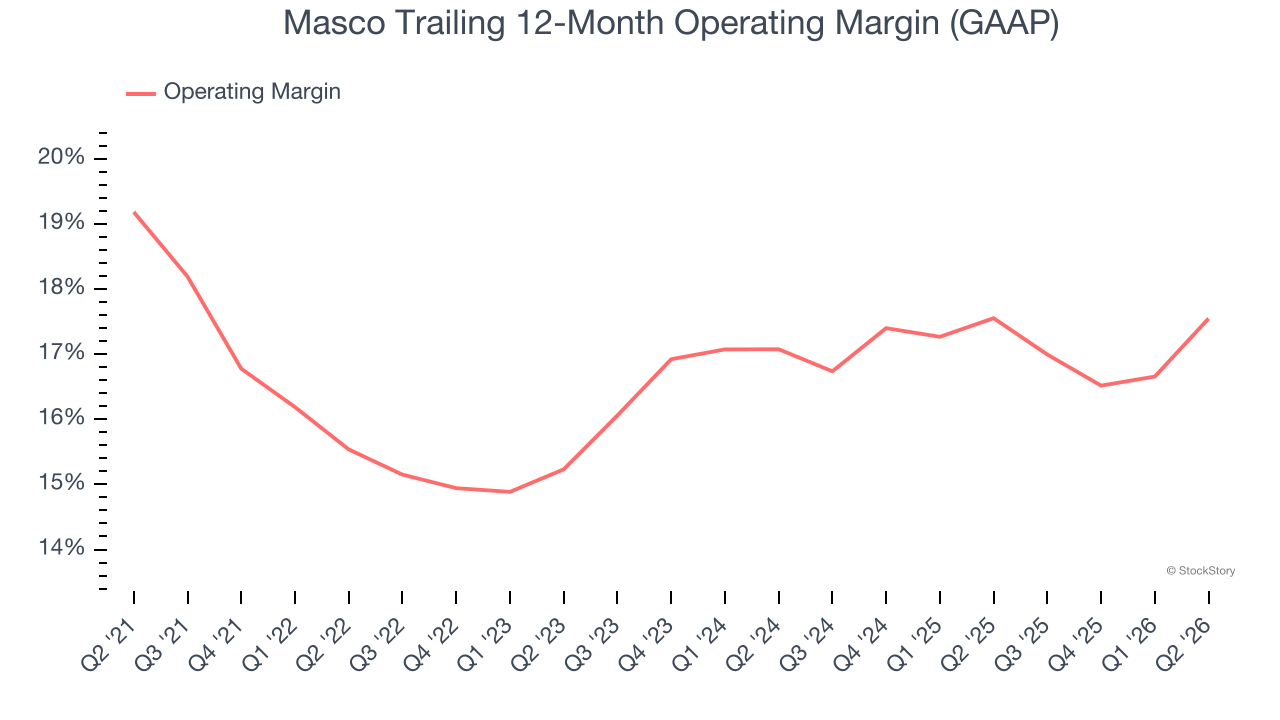
In Q2, Masco generated an operating margin profit margin of 23.6%, up 3.5 percentage points year on year. Since its gross margin expanded more than its operating margin, we can infer that leverage on its cost of sales was the primary driver behind the recently higher efficiency.
Earnings Per Share
Revenue trends explain a company’s historical growth, but the long-term change in earnings per share (EPS) points to the profitability of that growth — for example, a company could inflate its sales through excessive spending on advertising and promotions.
Masco’s EPS grew at 3.2% compounded annual growth rate over the last five years. On the bright side, this performance was better than its flat revenue and tells us management responded to softer demand by adapting its cost structure.
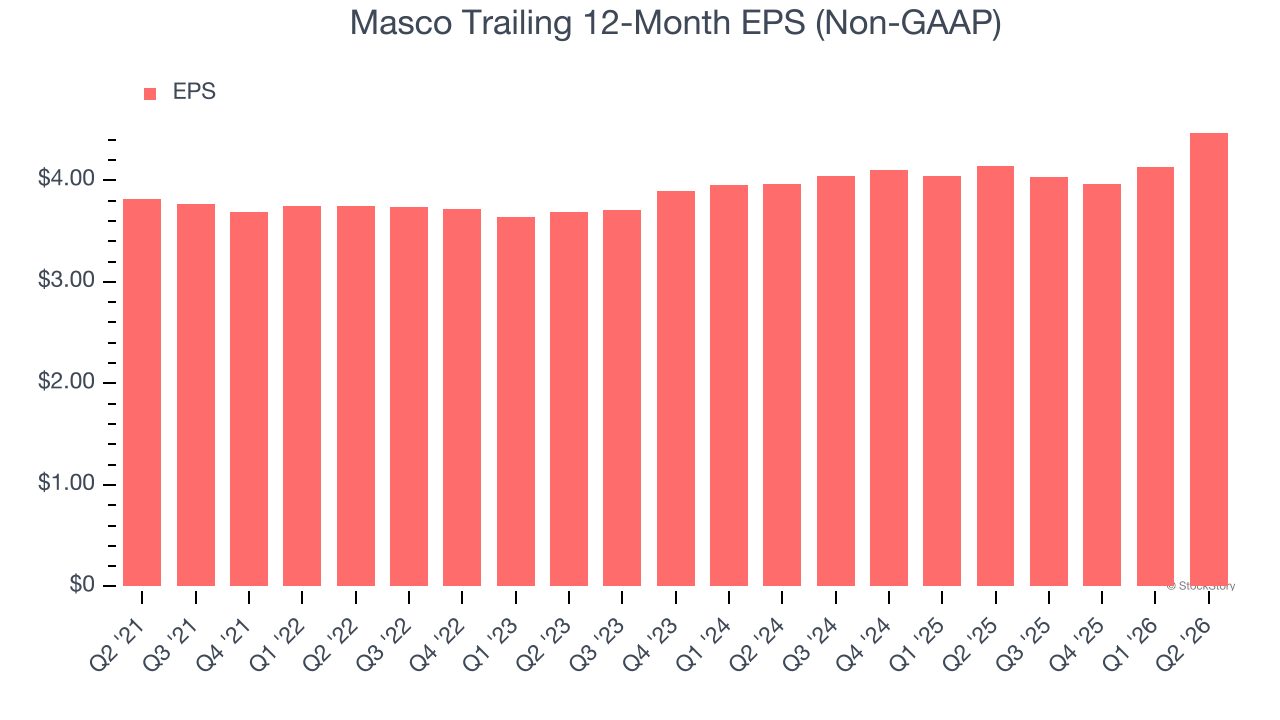
We can take a deeper look into Masco’s earnings to better understand the drivers of its performance. As we mentioned earlier, Masco’s operating margin expanded by 2 percentage points over the last five years. On top of that, its share count shrank by 21%. These are positive signs for shareholders because improving profitability and share buybacks turbocharge EPS growth relative to revenue growth. 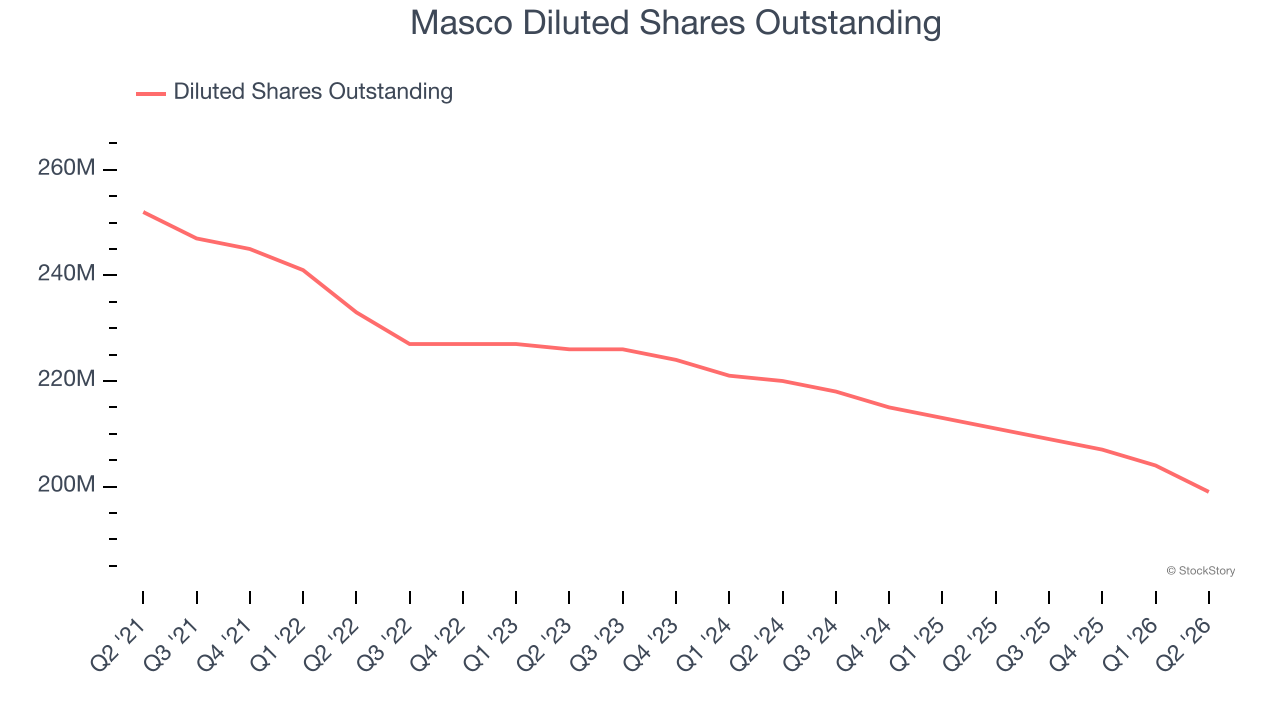
Like with revenue, we analyze EPS over a shorter period to see if we are missing a change in the business.
For Masco, its two-year annual EPS growth of 6.2% was higher than its five-year trend. Accelerating earnings growth is almost always an encouraging data point.
In Q2, Masco reported adjusted EPS of $1.64, up from $1.30 in the same quarter last year. This print easily cleared analysts’ estimates, and shareholders should be content with the results. Over the next 12 months, Wall Street expects Masco’s full-year EPS to stay about the same, moving from $4.47 to $4.50.
Key Takeaways from Masco’s Q2 Results
It was good to see Masco beat analysts’ EPS expectations this quarter, with full-year EPS guidance raised. We were also excited its EBITDA outperformed Wall Street’s estimates by a wide margin. On the other hand, its revenue missed. Overall, we think this was a mixed quarter. The stock remained flat at $81 immediately following the results.
Should you buy the stock or not? When making that decision, it’s important to consider its valuation, business qualities, as well as what has happened in the latest quarter. We cover that in our actionable full research report which you can read here (it’s free).