
Insurance specialty broker Ryan Specialty (NYSE: RYAN) reported Q1 CY2026 results beating Wall Street’s revenue expectations, with sales up 15.2% year on year to $795.2 million. Its non-GAAP profit of $0.47 per share was 8.7% above analysts’ consensus estimates.
Is now the time to buy Ryan Specialty? Find out by accessing our full research report, it’s free.
Ryan Specialty (RYAN) Q1 CY2026 Highlights:
- Revenue: $795.2 million vs analyst estimates of $778.8 million (15.2% year-on-year growth, 2.1% beat)
- Adjusted EPS: $0.47 vs analyst estimates of $0.43 (8.7% beat)
- Adjusted EBITDA: $232 million vs analyst estimates of $215.5 million (29.2% margin, 7.7% beat)
- Operating Margin: 11.9%, down from 14.5% in the same quarter last year
- Free Cash Flow was -$180.7 million compared to -$159.6 million in the same quarter last year
- Market Capitalization: $4.54 billion
Company Overview
Founded in 2010 by insurance industry veteran Patrick Ryan, Ryan Specialty (NYSE: RYAN) is a wholesale insurance broker and underwriting manager that helps retail brokers place complex or hard-to-place risks with insurance carriers.
Revenue Growth
Examining a company’s long-term performance can provide clues about its quality. Any business can put up a good quarter or two, but the best consistently grow over the long haul.
With $3.16 billion in revenue over the past 12 months, Ryan Specialty is a mid-sized business services company, which sometimes brings disadvantages compared to larger competitors benefiting from better economies of scale. On the bright side, it can still flex high growth rates because it’s working from a smaller revenue base.
As you can see below, Ryan Specialty’s sales grew at an incredible 23% compounded annual growth rate over the last five years. This is a great starting point for our analysis because it shows Ryan Specialty’s demand was higher than many business services companies.
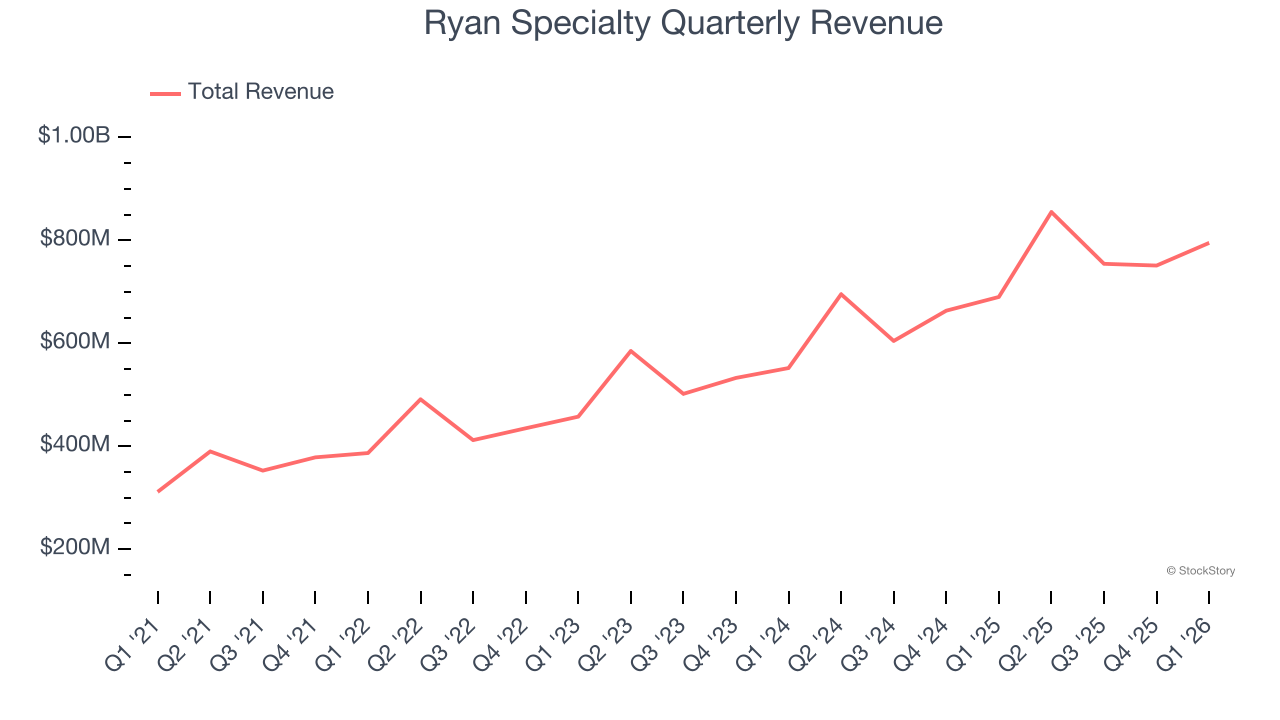
Long-term growth is the most important, but within business services, a half-decade historical view may miss new innovations or demand cycles. Ryan Specialty’s annualized revenue growth of 20.5% over the last two years is below its five-year trend, but we still think the results suggest healthy demand. 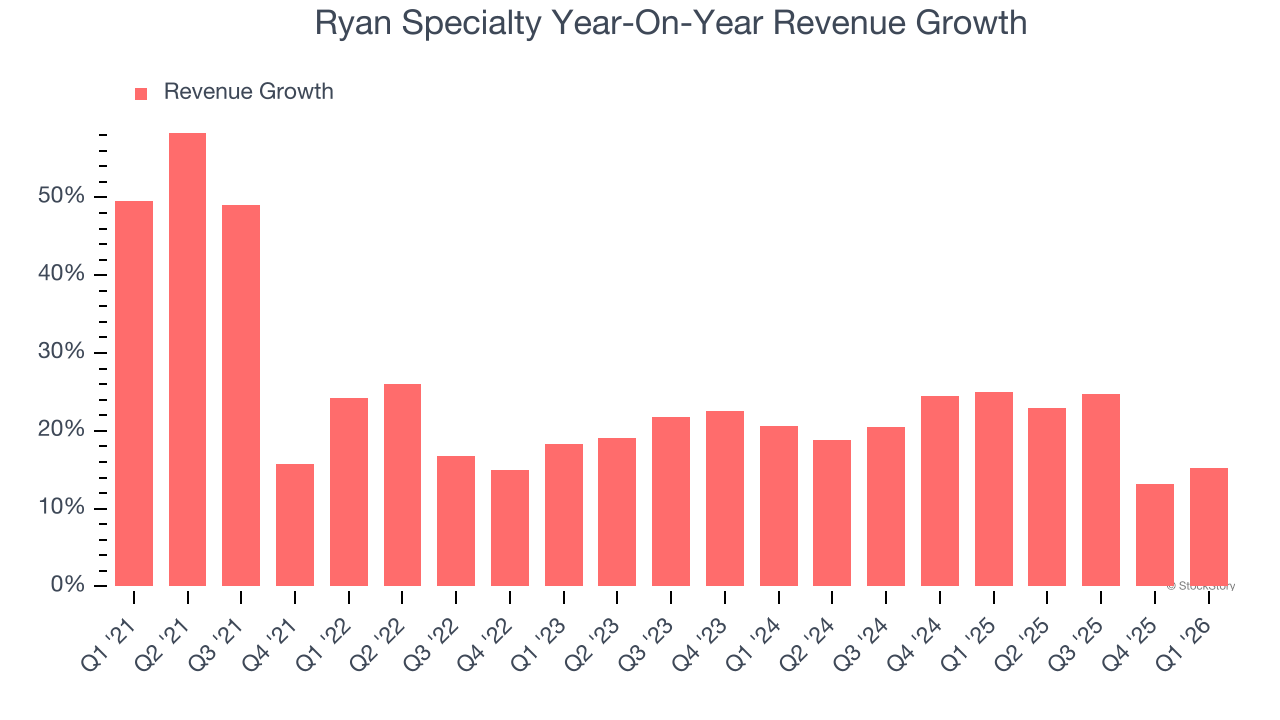
This quarter, Ryan Specialty reported year-on-year revenue growth of 15.2%, and its $795.2 million of revenue exceeded Wall Street’s estimates by 2.1%.
Looking ahead, sell-side analysts expect revenue to grow 9.1% over the next 12 months, a deceleration versus the last two years. Despite the slowdown, this projection is admirable and implies the market sees success for its products and services.
ONE MORE THING: 3 Hidden Platforms Growing 3X Faster than Amazon, Google, and PayPal. Amazon, Google, and Meta all followed the same playbook: Dominate an ignored market. Build an unbeatable moat. Scale until you’re unstoppable.
These three platforms are running that exact playbook right now. The early investors in Amazon made fortunes. The early investors in these could do the same. Get All 3 Stocks Here for FREE.
Adjusted Operating Margin
Adjusted operating margin is a key measure of profitability. Think of it as net income (the bottom line) excluding the impact of non-recurring expenses, taxes, and interest on debt - metrics less connected to business fundamentals.
Ryan Specialty has been an efficient company over the last five years. It was one of the more profitable businesses in the business services sector, boasting an average adjusted operating margin of 16.2%.
Looking at the trend in its profitability, Ryan Specialty’s adjusted operating margin rose by 3.4 percentage points over the last five years, as its sales growth gave it operating leverage.
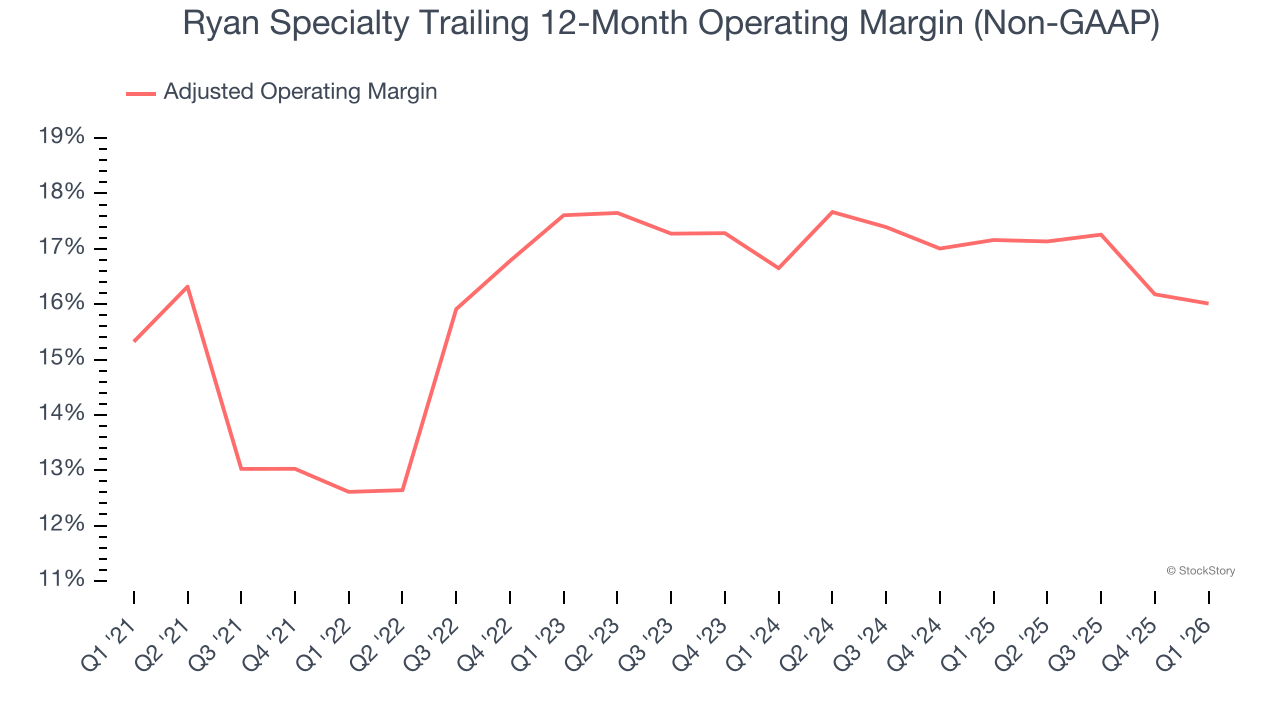
In Q1, Ryan Specialty generated an adjusted operating margin profit margin of 14.1%, in line with the same quarter last year. This indicates the company’s overall cost structure has been relatively stable.
Earnings Per Share
We track the long-term change in earnings per share (EPS) for the same reason as long-term revenue growth. Compared to revenue, however, EPS highlights whether a company’s growth is profitable.
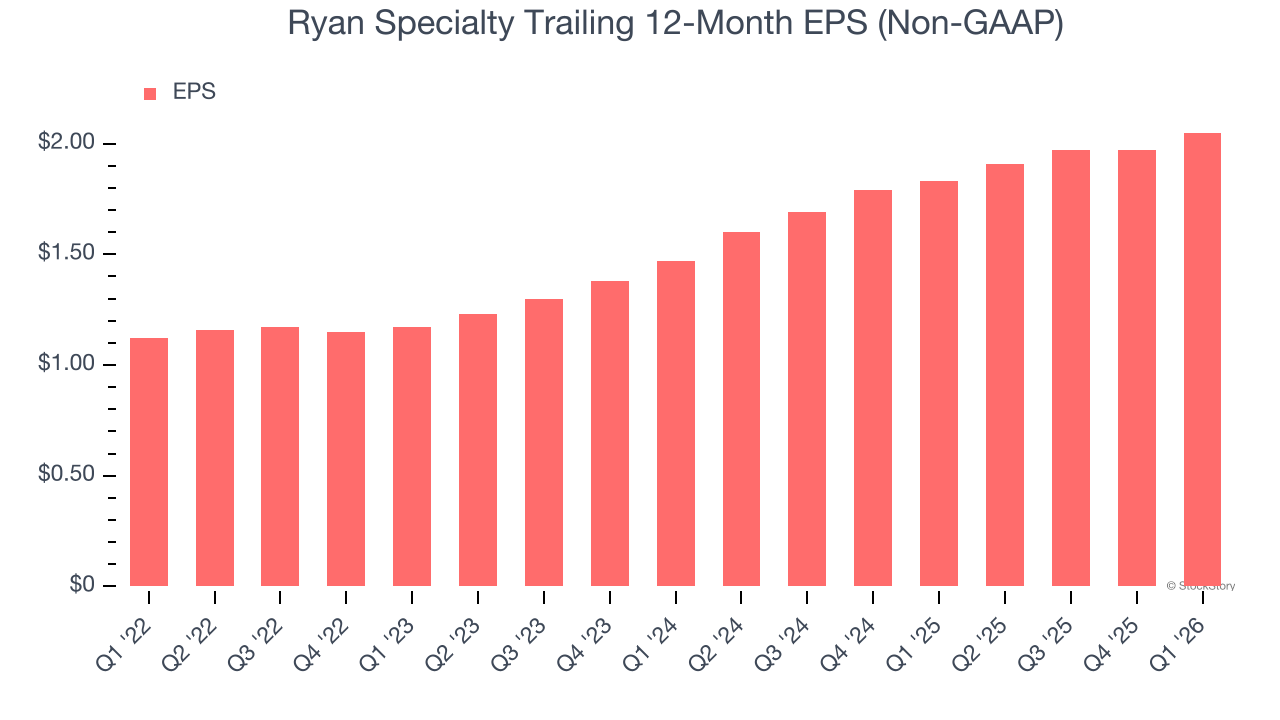
Ryan Specialty’s full-year EPS grew at an astounding 16.2% compounded annual growth rate over the last four years, better than the broader business services sector.
Like with revenue, we analyze EPS over a more recent period because it can provide insight into an emerging theme or development for the business.
Ryan Specialty’s EPS grew at a spectacular 18.1% compounded annual growth rate over the last two years. This performance was better than most business services businesses.
In Q1, Ryan Specialty reported adjusted EPS of $0.47, up from $0.39 in the same quarter last year. This print beat analysts’ estimates by 8.7%. Over the next 12 months, Wall Street expects Ryan Specialty’s full-year EPS of $2.05 to grow 12.4%.
Key Takeaways from Ryan Specialty’s Q1 Results
It was good to see Ryan Specialty beat analysts’ EPS expectations this quarter. We were also happy its revenue outperformed Wall Street’s estimates. Zooming out, we think this quarter featured some important positives. Investors were likely hoping for more, and shares traded down 2.5% to $33.88 immediately after reporting.
Should you buy the stock or not? We think that the latest quarter is only one piece of the longer-term business quality puzzle. Quality, when combined with valuation, can help determine if the stock is a buy. We cover that in our actionable full research report which you can read here (it’s free).


