
Life sciences tools company Agilent Technologies (NYSE: A) met Wall Street’s revenue expectations in Q4 CY2025, with sales up 7% year on year to $1.8 billion. The company expects next quarter’s revenue to be around $1.81 billion, coming in 2.2% above analysts’ estimates. Its non-GAAP profit of $1.36 per share was in line with analysts’ consensus estimates.
Is now the time to buy Agilent? Find out by accessing our full research report, it’s free.
Agilent (A) Q4 CY2025 Highlights:
- Revenue: $1.8 billion vs analyst estimates of $1.81 billion (7% year-on-year growth, in line)
- Adjusted EPS: $1.36 vs analyst estimates of $1.37 (in line)
- Adjusted EBITDA: $461 million vs analyst estimates of $490.2 million (25.6% margin, 5.9% miss)
- Revenue Guidance for the full year is $7.4 billion at the midpoint, roughly in line with what analysts were expecting
- Adjusted EPS guidance for the full year is $5.97 at the midpoint, beating analyst estimates by 0.6%
- Operating Margin: 19.6%, down from 22.4% in the same quarter last year
- Free Cash Flow Margin: 9.7%, down from 19.9% in the same quarter last year
- Organic Revenue rose 4.4% year on year (miss)
- Market Capitalization: $35.19 billion
Company Overview
Originally spun off from Hewlett-Packard in 1999 as its measurement and analytical division, Agilent Technologies (NYSE: A) provides analytical instruments, software, services, and consumables for laboratory workflows in life sciences, diagnostics, and applied chemical markets.
Revenue Growth
A company’s long-term performance is an indicator of its overall quality. Any business can experience short-term success, but top-performing ones enjoy sustained growth for years. Unfortunately, Agilent’s 5% annualized revenue growth over the last five years was mediocre. This fell short of our benchmark for the healthcare sector and is a poor baseline for our analysis.
Long-term growth is the most important, but within healthcare, a half-decade historical view may miss new innovations or demand cycles. Agilent’s recent performance shows its demand has slowed as its annualized revenue growth of 2.4% over the last two years was below its five-year trend. We’re wary when companies in the sector see decelerations in revenue growth, as it could signal changing consumer tastes aided by low switching costs. 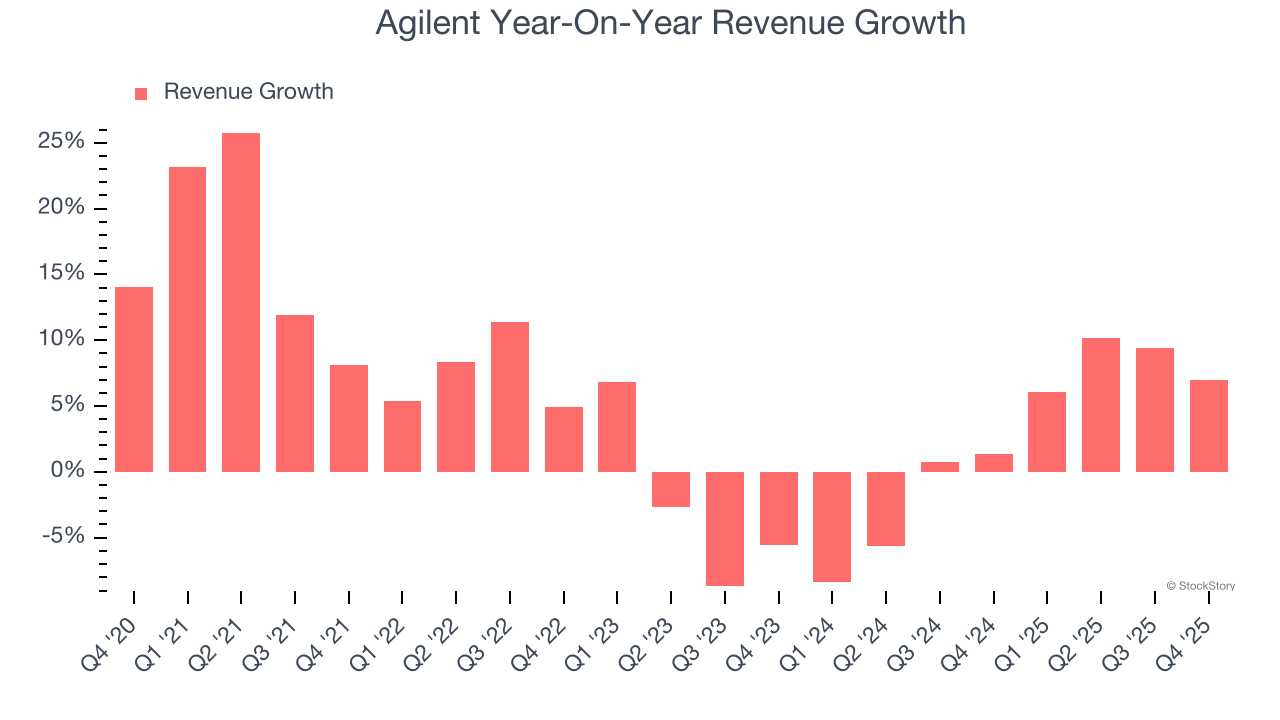
We can better understand the company’s sales dynamics by analyzing its organic revenue, which strips out one-time events like acquisitions and currency fluctuations that don’t accurately reflect its fundamentals. Over the last two years, Agilent’s organic revenue averaged 4.2% year-on-year growth. Because this number is better than its two-year revenue growth, we can see that some mixture of divestitures and foreign exchange rates dampened its headline results. 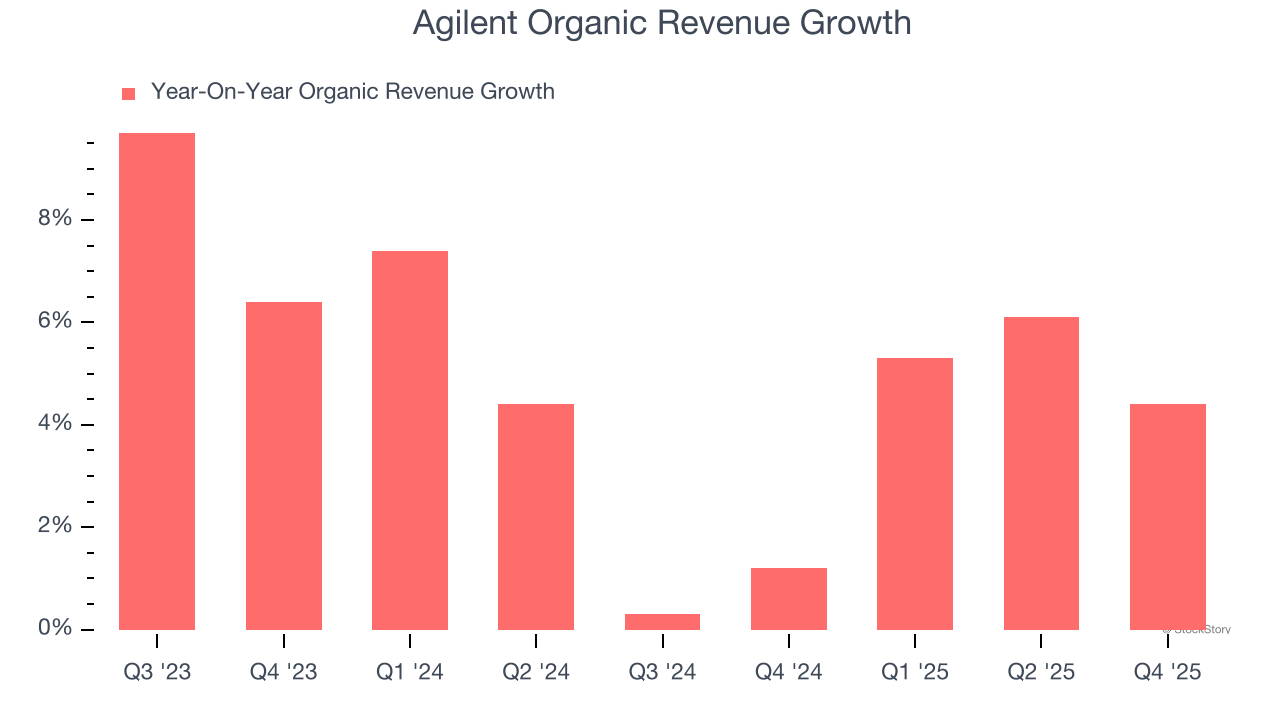
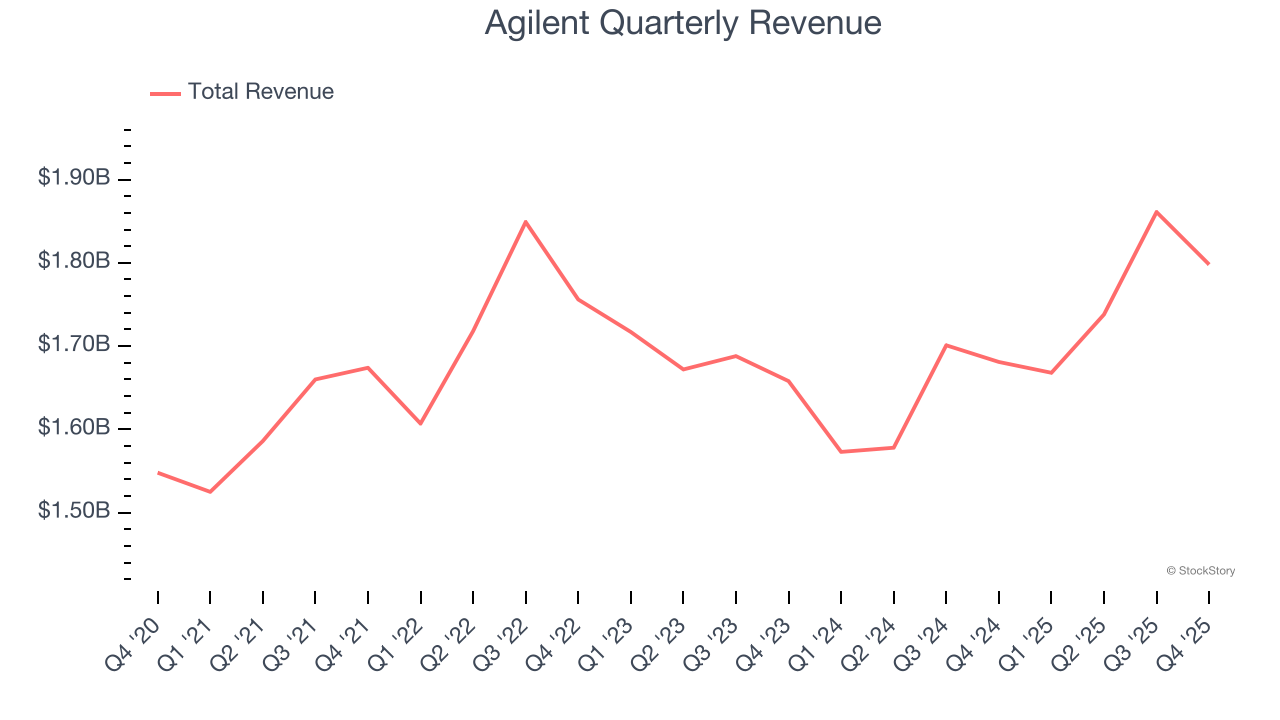
This quarter, Agilent grew its revenue by 7% year on year, and its $1.8 billion of revenue was in line with Wall Street’s estimates. Company management is currently guiding for a 8.2% year-on-year increase in sales next quarter.
Looking further ahead, sell-side analysts expect revenue to grow 5.6% over the next 12 months, an improvement versus the last two years. This projection is above the sector average and implies its newer products and services will catalyze better top-line performance.
Software is eating the world and there is virtually no industry left that has been untouched by it. That drives increasing demand for tools helping software developers do their jobs, whether it be monitoring critical cloud infrastructure, integrating audio and video functionality, or ensuring smooth content streaming. Click here to access a free report on our 3 favorite stocks to play this generational megatrend.
Operating Margin
Operating margin is one of the best measures of profitability because it tells us how much money a company takes home after subtracting all core expenses, like marketing and R&D.
Agilent has been an efficient company over the last five years. It was one of the more profitable businesses in the healthcare sector, boasting an average operating margin of 21.7%.
Analyzing the trend in its profitability, Agilent’s operating margin decreased by 1 percentage points over the last five years, but it rose by 1.2 percentage points on a two-year basis. Still, shareholders will want to see Agilent become more profitable in the future.
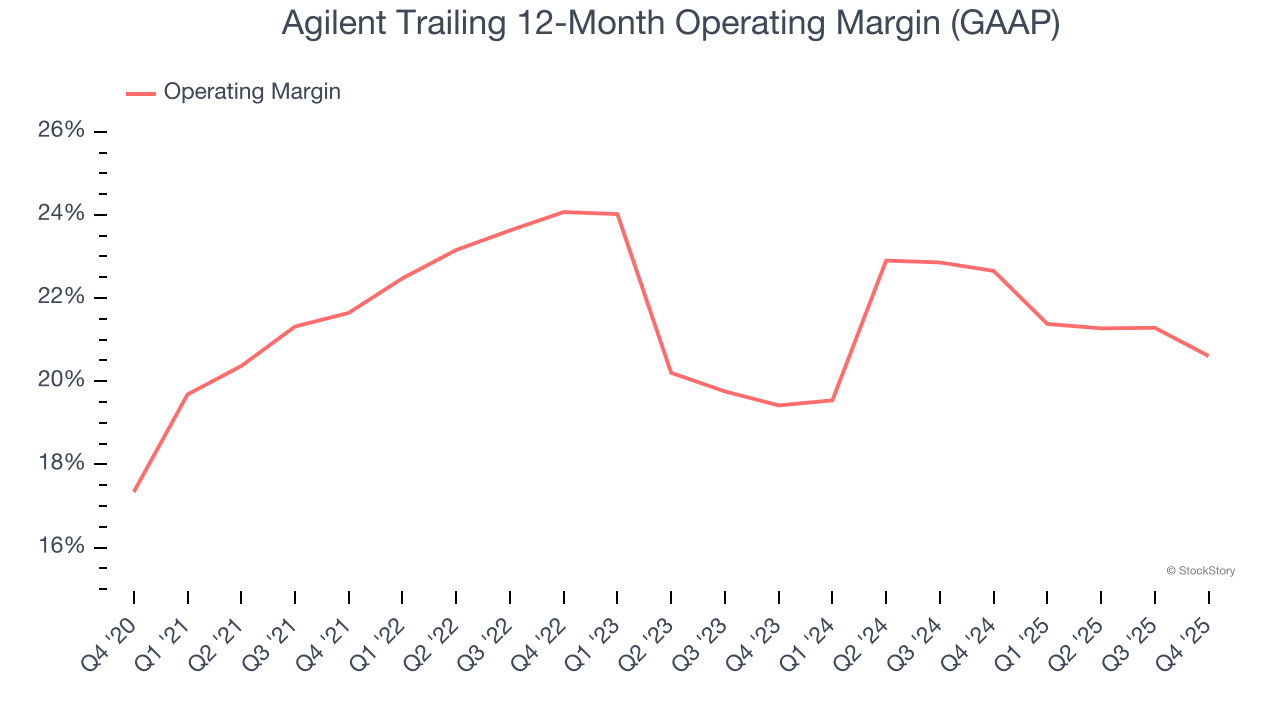
In Q4, Agilent generated an operating margin profit margin of 19.6%, down 2.7 percentage points year on year. This contraction shows it was less efficient because its expenses grew faster than its revenue.
Earnings Per Share
Revenue trends explain a company’s historical growth, but the long-term change in earnings per share (EPS) points to the profitability of that growth – for example, a company could inflate its sales through excessive spending on advertising and promotions.
Agilent’s EPS grew at a remarkable 9.8% compounded annual growth rate over the last five years, higher than its 5% annualized revenue growth. However, this alone doesn’t tell us much about its business quality because its operating margin didn’t improve.
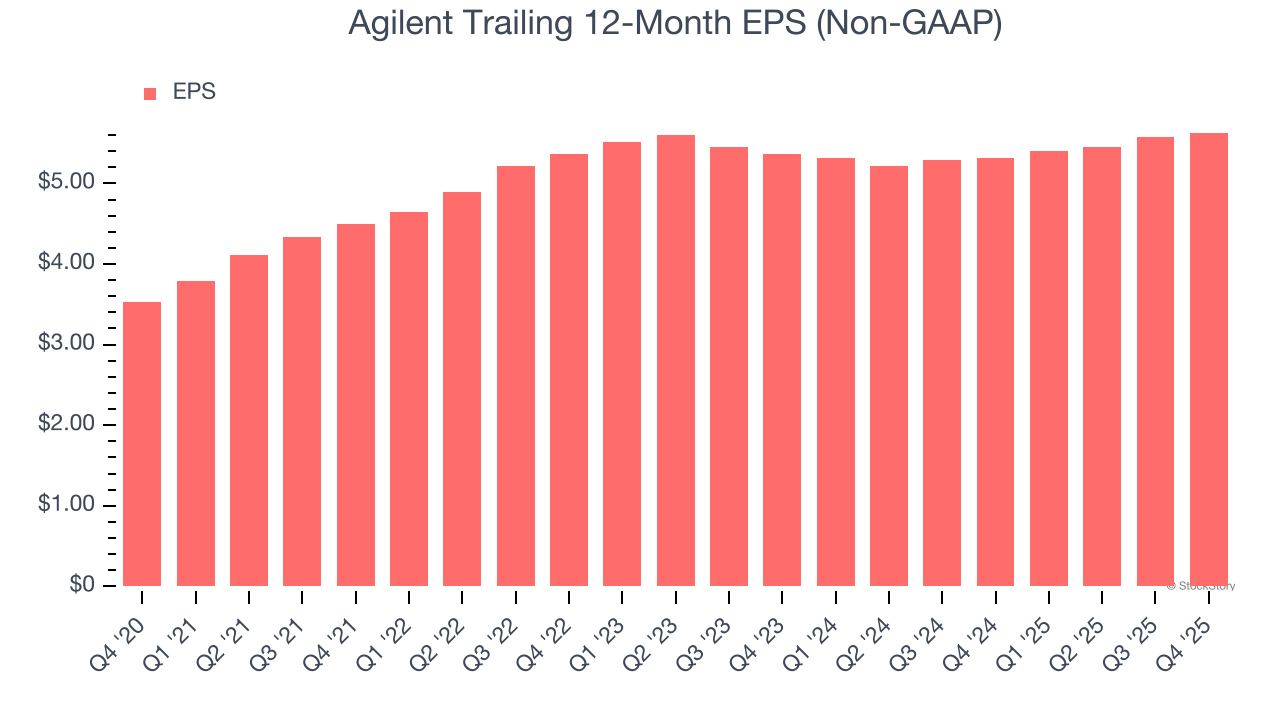
We can take a deeper look into Agilent’s earnings quality to better understand the drivers of its performance. A five-year view shows that Agilent has repurchased its stock, shrinking its share count by 8.1%. This tells us its EPS outperformed its revenue not because of increased operational efficiency but financial engineering, as buybacks boost per share earnings. 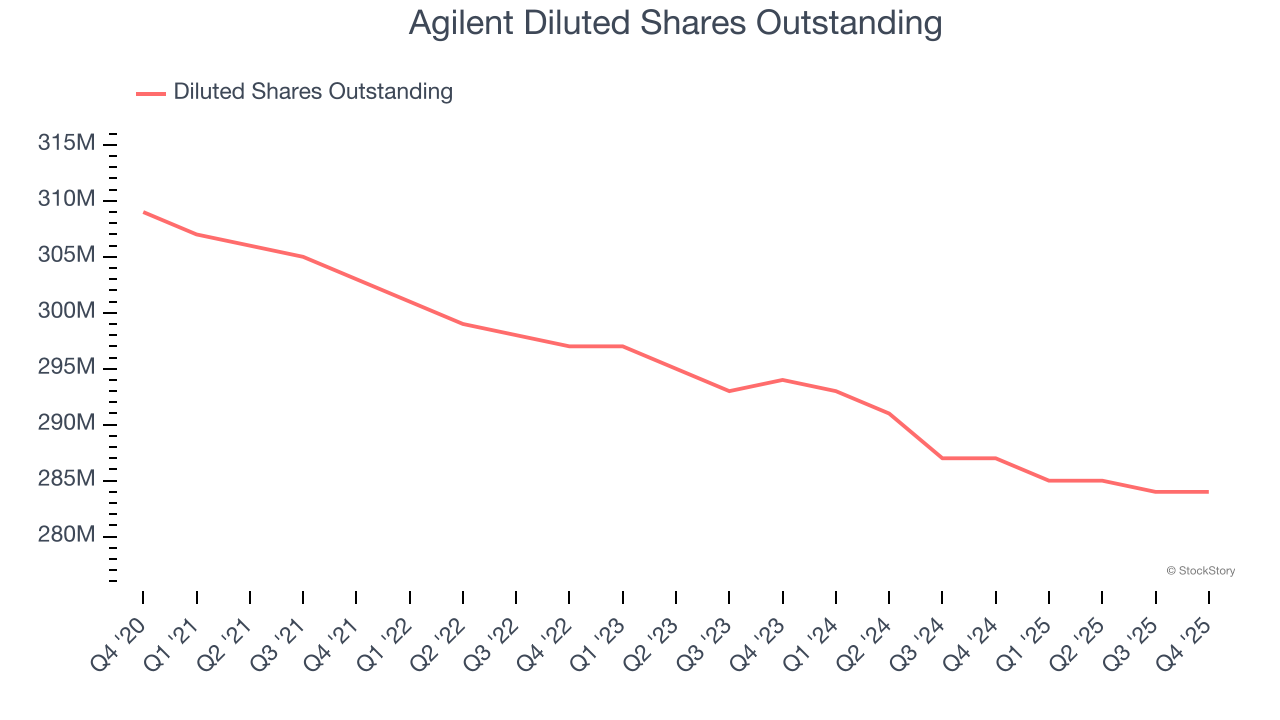
In Q4, Agilent reported adjusted EPS of $1.36, up from $1.31 in the same quarter last year. This print was close to analysts’ estimates. Over the next 12 months, Wall Street expects Agilent’s full-year EPS of $5.63 to grow 8.4%.
Key Takeaways from Agilent’s Q4 Results
It was great to see Agilent’s revenue guidance for next quarter top analysts’ expectations. We were also glad its full-year revenue guidance slightly exceeded Wall Street’s estimates. On the other hand, its revenue was in line and its organic revenue fell slightly short of Wall Street’s estimates. Zooming out, we think this was a mixed quarter. Investors were likely hoping for more, and shares traded down 2.6% to $121.45 immediately following the results.
Should you buy the stock or not? We think that the latest quarter is only one piece of the longer-term business quality puzzle. Quality, when combined with valuation, can help determine if the stock is a buy. We cover that in our actionable full research report which you can read here (it’s free).


