Those who are only able to see markets with the aid of imaginary government numbers are looking forward to Tuesday.
The rest of us know inflation is a real issue, one the US Federal Open Market Committee is going to have to continue to deal with.
Don’t Miss a Day: From crude oil to coffee, sign up free for Barchart’s best-in-class commodity analysis.In the Grains sector, the BRACE Industry is eagerly awaiting the fourth first look at new-crop supply and demand.
Morning Summary: If Monday was a day for commodity complex bulls, Tuesday is scheduled to bring a holiday-like atmosphere for those in the BRACE[i] Industry who’ve never met a government number they didn’t view as incredibly important. While still in the throes of euphoria from Monday afternoon’s weekly nonsense known as crop progress and/or conditions from NASS, Tuesday morning will get rolling with all the April Consumer Price Indexes (CPI) which are expected to show the highest prices in nearly 3 years. Let’s be honest, if we can’t see prices for everything (yes, I’m setting aside the Vodka Vacuity here) are high and rising – and understand why – then there isn’t much that can be said at this point. Once the CPI nugget has passed through the system, those in the Grains sector will be looking forward to the May round of USDA WASDE numbers, also known as the Fourth First Look at New-Crop Supply and Demand[ii]. While rational human beings are finally starting to understand the stupidity of the system[iii], Watson will be moved to trade once again. As for Tuesday morning markets, the key is the Financials sector (US Treasury futures) is in the red, indicating Treasury yields are rising, an indicator markets are anticipating higher rates to combat increased inflation.
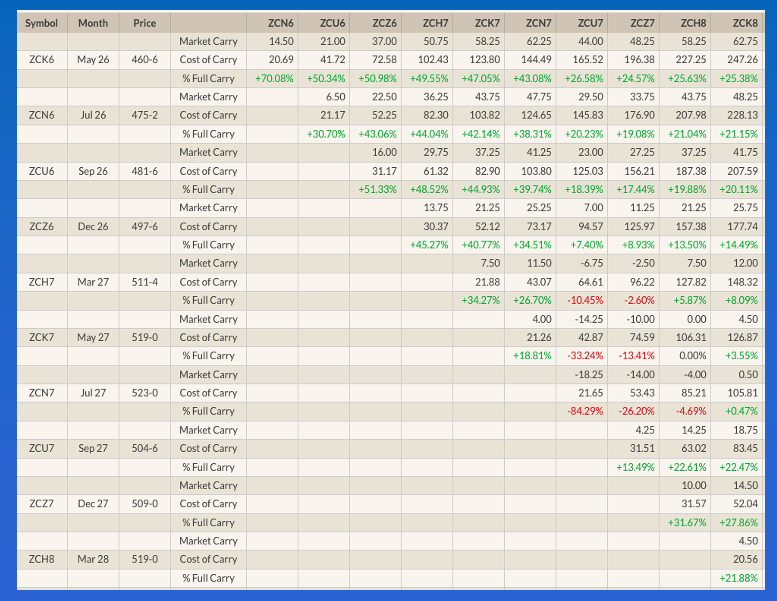
Corn: After closing higher Monday, recall July and September finished 4.0 cents in the green with December up 4.25 cents, the corn market was quietly lower overnight through early Tuesday morning. July (ZCN26) posted a 2.0-cent trading range on trade volume of 17,000 contracts and was sitting 0.5 cent lower at this writing. Will the market perk up a bit post-WASDE? Most likely, though the attention will again be on the fourth first look at new-crop supply and demand guesses. As for old-crop supply and demand, the National Corn Index came in Monday night at $4.3475, up roughly 4.0 cents and putting national average basis at 40.5 cents under July futures as compared to the previous 10-year low weekly close for this week of 37.25 cents under July. What we know from this is whatever the made-up old-crop supply and demand numbers turn out to be, real available supplies remain more than adequate to meet real demand. Over in new-crop, Monday’s close saw the September-December futures spread covering 51% calculated full commercial carry and the December-March 45%, both indicating a neutral initial commercial view of the US 2026 crop. Do I care about continued acreage and yield guesses? No. All I’m interested is the trend of how these spreads are trending[iv] over time.
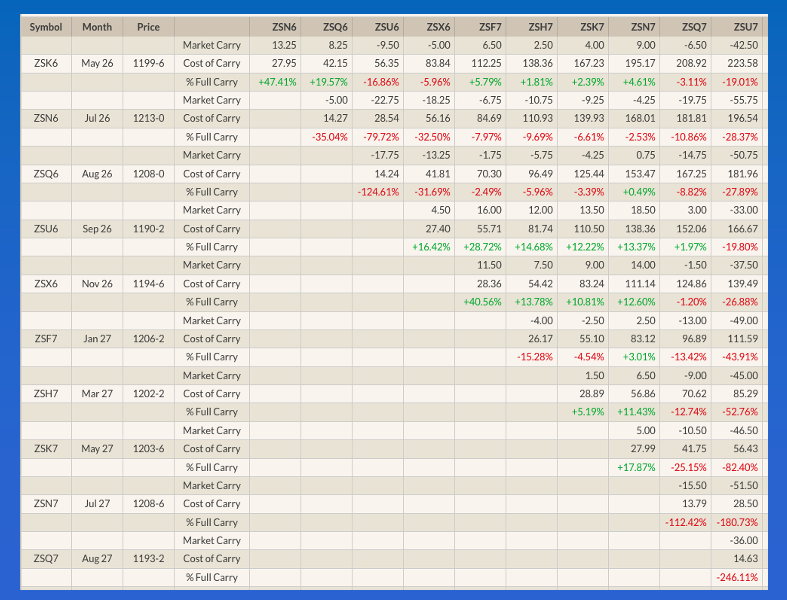
Soybeans: The oilseed sub-sector was in the green early Tuesday morning with soybean oil back in the lead after taking a break Monday. Recall July bean oil (ZLN26) closed 0.58 cent lower despite the continued rally in diesel fuel (distillates, heating oil, etc.) to open the week. A look at overnight headlines shows nothing has changed with the US president’s War on Iran, something we already knew and could read with the Energies sector also green across the board. For the record, the spot-month diesel contract (HOM26) was up 11.5 cents (2.9%) at this writing. Back to bean oil where July was up 0.6 cent (0.8%), erasing Monday’s selloff with a lot of day ahead. July soybeans (ZSN26) closed yesterday with a gain of 5.5 cents followed by the National Soybean Index coming in $11.4525, up 5.25 cents for the day and putting national average basis at 67.75 cents under July futures. The previous 5-year low weekly close for this week is 63.0 cents under July. New-crop November was up 1.75 cents pre-dawn after closing 5.25 cents higher Monday. The Nov-January futures spread covered a neutral 40.5% calculated full commercial carry with the January-March still showing an inverse of 4.0 cents. Fundamentally, new-crop spreads remain neutral-to-bullish.
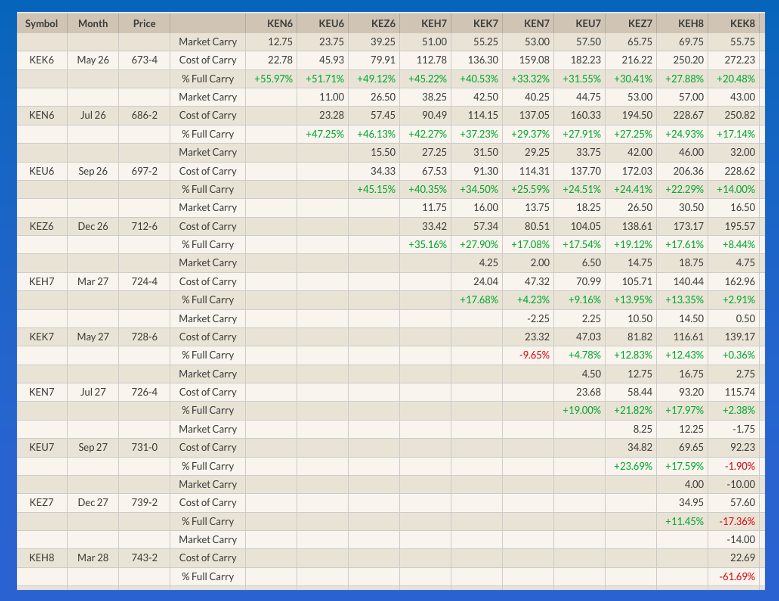
Wheat: The wheat sub-sector was glowing green early Tuesday morning led by strong rallies in both winter markets. I know the hue and cry will be about the latest NASS weekly crop condition numbers, but what if we were to take a step back and look at the reality of the situation? Is anyone interested in that these days? I don’t know, but let’s do it anyway. Is the HRW crop in bad shape? From what I’ve heard from those who actually know, yes. What does the market think? At Monday’s close, the July-September futures spread covered 47% calculated full commercial carry with the September-December covering 45%, both solidly neutral numbers. However, these spreads have been trending up (weekly close only) meaning they’ve been covering less calculated full commercial carry over time telling us there has been a growing concern regarding the 2026 HRW crop. But the fact spreads are not bullish tells us the commercial side also knows demand isn’t expected to overwhelm available supplies. Additionally, last Friday night saw national average basis calculated at 67.75 cents under July futures (KEN26) and 78.5 cents under September (KEU26), both still weak compared to the previous 5-year low weekly closes of 69.5 cents under and 57.75 cents under respectively.
[i] BRACE = Broker/Reporter/Analyst/Commentator/Economist who like to tell all of us how important each and every government report is.
[ii] 1) USDA Baseline, released late last fall or early winter 2) USDA Annual Ag Forum in February 3) March 31 Prospective Plantings report
[iii] My friend Elizabeth Volk sent me this Bloomberg piece recently: (LINK)
[iv] Market Rule #1: Don’t get crossways with the trend.
On the date of publication, Darin Newsom did not have (either directly or indirectly) positions in any of the securities mentioned in this article. All information and data in this article is solely for informational purposes. For more information please view the Barchart Disclosure Policy here.
More news from Barchart