I concluded my January 16 Barchart quarterly report on the grain and oilseed markets with the following:
Global population growth increases the demand side of grain and oilseed fundamental equations, and each year, supplies must keep pace with the growing demand. The current price levels could limit downside risks, while the upside could be explosive if weather conditions create shortages.
Don’t Miss a Day: From crude oil to coffee, sign up free for Barchart’s best-in-class commodity analysis.
I am cautiously bullish on grain and oilseed prices in 2026, as the risk-reward favors the upside.
Nearby CBOT soybean futures moved 3.23% higher in 2025, settling at $10.3050 per bushel on December 31, 2025. Over the past few weeks, soybean prices have rallied, pushing above $11 per bushel.
Soybeans are in a bullish trend
Nearby soybean futures found a bottom after reaching a low of $9.47 per bushel in December 2024.
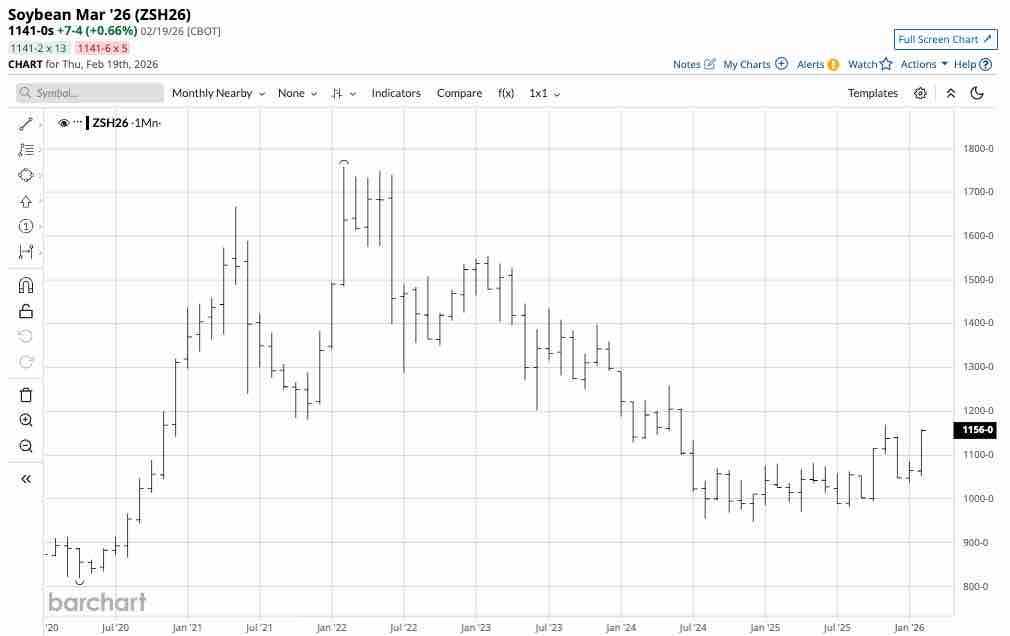
The monthly continuous futures contract chart shows that the nearby soybean futures have made higher lows and higher highs since late 2024, rising 23.5% to the most recent high of $11.6950 per bushel in November 2025. At $11.41 on February 18, soybean futures were within striking distance of the November 2025 high and remained in a bullish trend.
The February WASDE report was not bullish for the beans
The U.S. Department of Agriculture released its latest February World Agricultural Supply and Demand Estimates Report before the start of the 2026 Northern Hemisphere crop year on February 10, 2026. The WASDE Report told the soybean market:
The WASDE report was not bullish as it said that U.S. and global soybean inventories rose from the previous report. The WASDE left its soybean price forecast unchanged at $10.20 per bushel, which is over $1 below the current March 2026 futures price.
I reached out to Jake Hanley, the Chief Growth Officer and Director of Investments at the Teucrium family of agricultural ETF products. Jake told me:
Soybean prices recently got a lift in the wake of the President’s discussion with the Chinese which resulted in an announcement that China will be purchasing another 8 million metric tons of beans for the current marketing year. The domestic soybean balance sheet is tight relative to corn, which could lead to ideas that bean prices will advance, or at least remain firm, relative to corn in effort to “bid for acres.” It’s likely corn will give way to some soybean acres this Spring.
While the WASDE was mostly bearish, Chinese demand for U.S. soybeans and a relaxation of U.S. tariffs could boost demand and tighten soybeans’ supply-demand fundamentals over the coming months.
The weather across the leading growing areas is critical for the price over the coming months
The great uncertainty in each new crop year is always weather conditions across the leading growing areas during the planting, growing, and harvest seasons. Soybean futures reached a bottom in November 2025 after the last crop year produced ample supplies to meet global demand. However, 2025 supplies do not guarantee that the weather over the coming months will produce another bumper crop.
Levels to watch in the soybean futures market- Chinese demand is critical
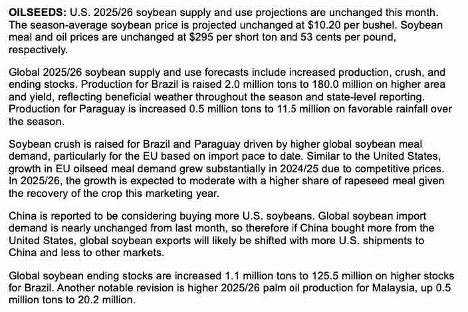
As the March CBOT soybean futures will roll to the May contract over the coming days and weeks, the critical technical levels in May futures require careful attention.
The one-year chart of May futures shows that technical resistance is at the November 18, 2025, high of $11.7250 per bushel. Technical support is at $10.3775 per bushel the January 13, 2026 low.
While weather conditions will be the crucial factor in determining the path of least resistance for oilseed futures, Chinese demand for U.S. soybeans will also be a factor over the coming weeks and months. Meanwhile, short-term rallies over the coming weeks would likely encourage increased hedging among farmers, which could weigh on prices and cap rallies.
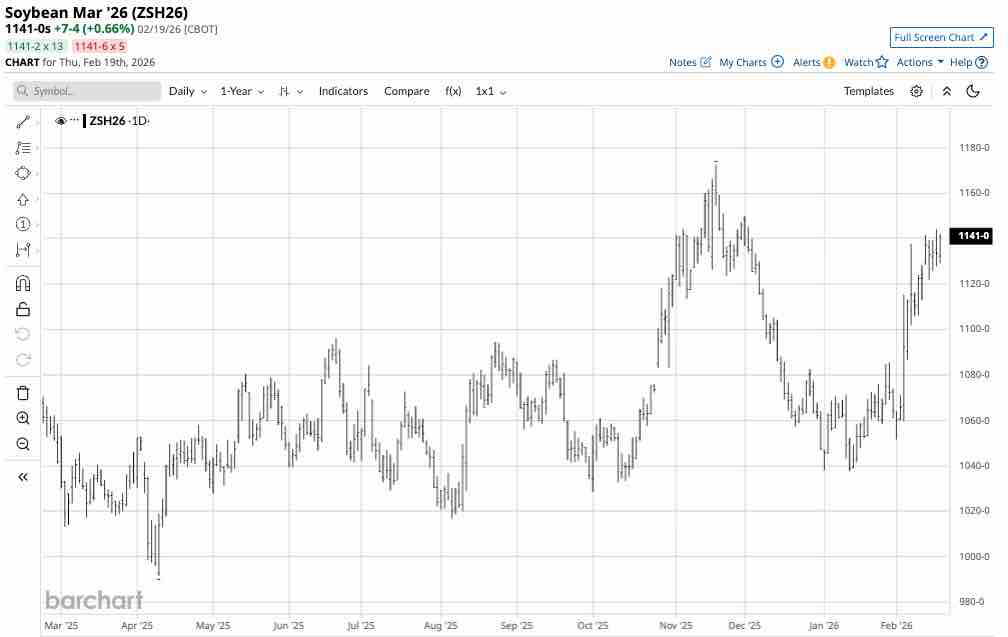
SOYB is an ETF that tracks a portfolio of soybean futures prices
The trend is always a trader’s or investor’s best friend, and it remains bullish in the soybean futures market. The most direct route for a soybean risk position is the futures and futures options on the CME’s CBOT division. The Teucrium Soybean ETF (SOYB) provides an alternative to the futures and trades on NYSE Arca, available to all market participants with a standard equity account. At $23.55 per share, SOYB had over $40.50 million in assets under management. SOYB trades an average of over 66,000 shares daily and charges a 0.83% management fee. SOYB owns a portfolio of three actively traded CBOT soybean futures contracts, excluding the nearby contract, to mitigate futures roll risks. Since the most speculative activity occurs in the nearby contract, SOYB tends to underperform the nearby contract on the upside and outperform it during price corrections.
The continuous soybean futures rallied 23.5% from the December 2024 low to the November 2025 high. The most recent correction took the continuous contract price 11.3% lower from $11.6950 in November 2025 to $10.3775 per bushel in January 2026.
The monthly chart shows that over the same period, the SOYB ETF rose 18.1% from $20.20 to $23.86 per share, before correcting 9.1% to $21.69 per share. SOYB underperformed the nearby contract on the upside and outperformed on the downside, on a percentage basis.
One of the ETF’s drawbacks is that it trades only during U.S. stock market hours, so it can miss highs or lows when the market is closed.
The weather across the fertile growing regions, Chinese U.S. soybean demand, and producer hedging over the coming weeks will determine whether the bullish trend continues into the 2026 crop year, beginning with the planting season in March and April.
On the date of publication, Andrew Hecht did not have (either directly or indirectly) positions in any of the securities mentioned in this article. All information and data in this article is solely for informational purposes. For more information please view the Barchart Disclosure Policy here.
More news from Barchart


