
Financial intelligence company S&P Global (NYSE: SPGI) reported Q2 CY2026 results exceeding the market’s revenue expectations, with sales up 10.4% year on year to $4.15 billion. Its non-GAAP profit of $4.83 per share was 3.7% below analysts’ consensus estimates.
Is now the time to buy S&P Global? Find out by accessing our full research report, it’s free.
S&P Global (SPGI) Q2 CY2026 Highlights:
- Revenue: $4.15 billion vs analyst estimates of $4.11 billion (10.4% year-on-year growth, 1% beat)
- Pre-tax Profit: $1.73 billion (41.7% margin)
- Adjusted EPS: $4.83 vs analyst expectations of $5.02 (3.7% miss)
- Management lowered its full-year Adjusted EPS guidance to $17.63 at the midpoint, a 9.7% decrease
- Market Capitalization: $130.2 billion
Company Overview
Tracing its roots back to 1860 when it published the first railroad industry manual, S&P Global (NYSE: SPGI) provides credit ratings, market intelligence, commodity data, automotive analytics, and financial indices that help investors and businesses make decisions.
Revenue Growth
A company’s long-term sales performance is one signal of its overall quality. Any business can experience short-term success, but top-performing ones enjoy sustained growth for years. Over the last five years, S&P Global grew its revenue at a decent 9% compounded annual growth rate. Its growth was slightly above the average financials company and shows its offerings resonate with customers.
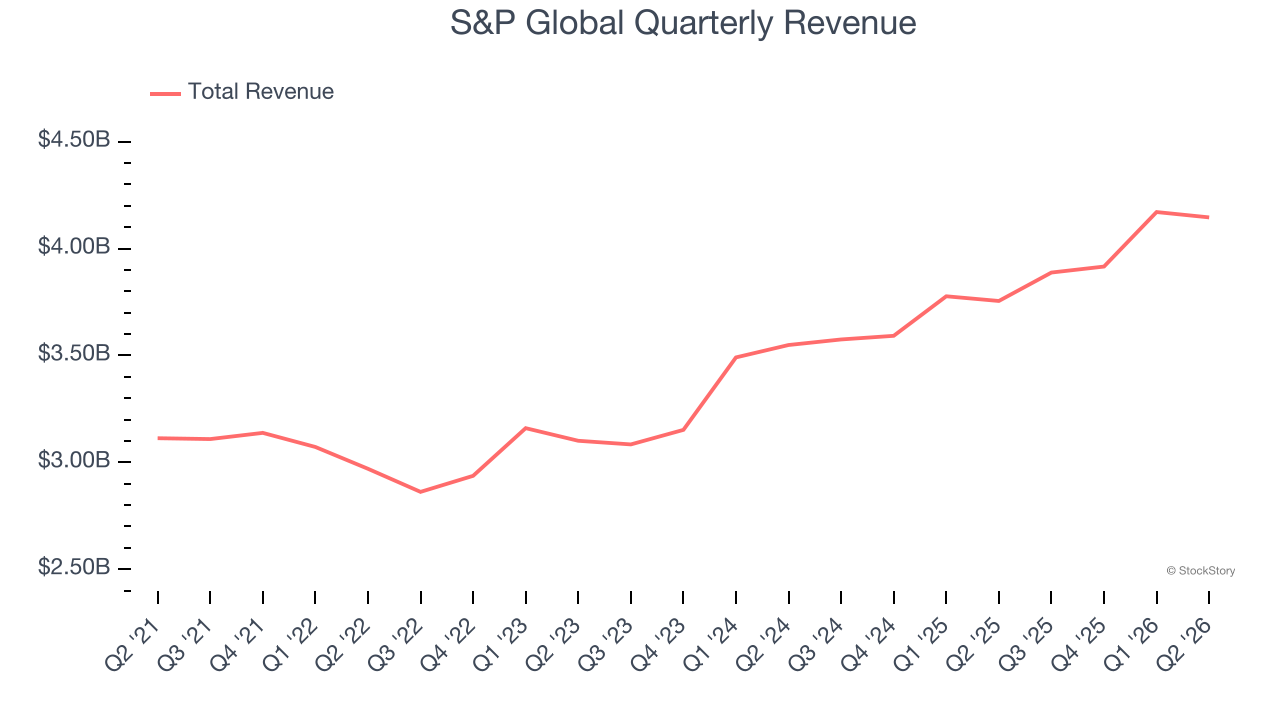
Long-term growth is the most important, but within financials, a half-decade historical view may miss recent interest rate changes and market returns. S&P Global’s annualized revenue growth of 10.2% over the last two years is above its five-year trend, suggesting some bright spots. 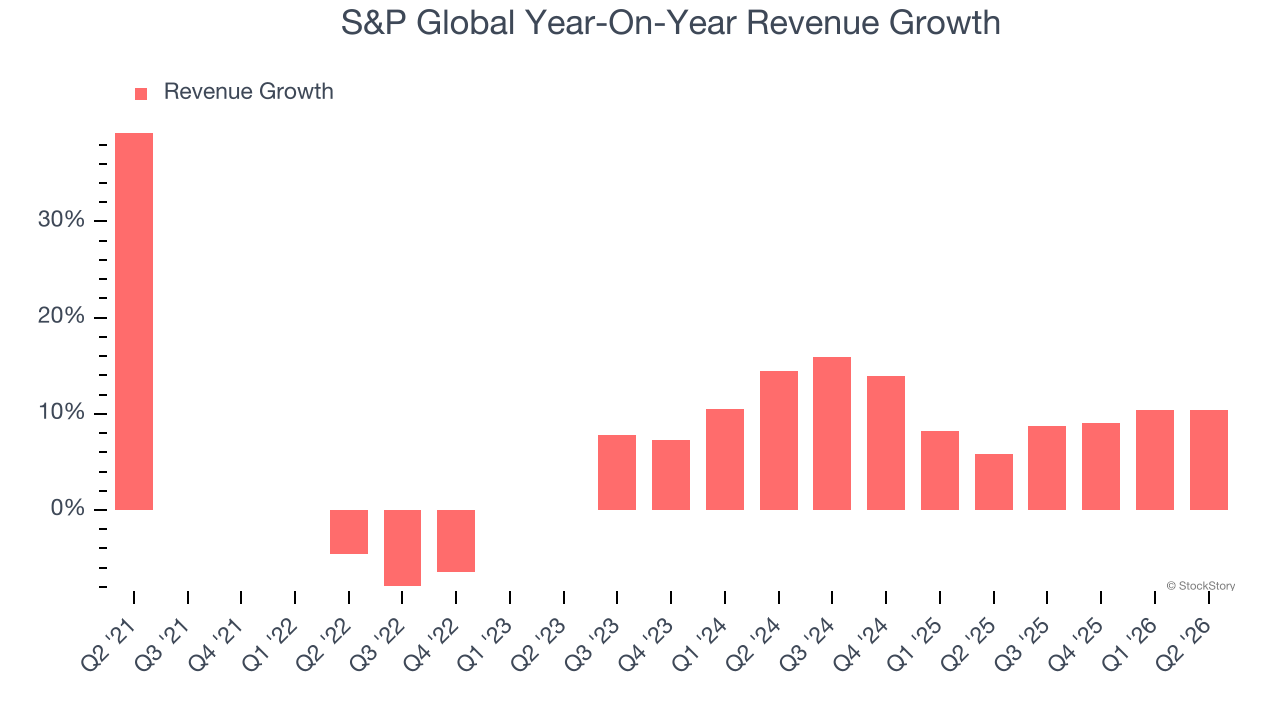 Note: Quarters not shown were determined to be outliers because they were impacted by outsized investment gains/losses that are not indicative of the recurring fundamentals of the business.
This quarter, S&P Global reported year-on-year revenue growth of 10.4%, and its $4.15 billion of revenue exceeded Wall Street’s estimates by 1%.
ONE MORE THING: The $21 AI Application Stock Wall Street Forgot. While Wall Street obsesses over who’s building AI, one company is already using it to print money. And nobody’s paying attention.
AI chip stocks trade at ridiculous valuations. This company processes a trillion consumer signals monthly using AI and trades at a third of the price. The gap won’t last. The institutions will figure it out. You need to see this first. Read the FREE Report Before They Notice.
Key Takeaways from S&P Global’s Q2 Results
S&P Global narrowly exceeded analysts’ revenue expectations for the quarter, but EPS fell short of Wall Street estimates. The company’s full-year EPS guidance also came in below expectations. Overall, this quarter could have been better. The stock traded down 2.7% to $428.04 immediately following the results.
S&P Global’s latest earnings report disappointed. One quarter doesn’t define a company’s quality, so let’s explore whether the stock is a buy at the current price. We think that the latest quarter is only one piece of the longer-term business quality puzzle. Quality, when combined with valuation, can help determine if the stock is a buy. We cover that in our actionable full research report which you can read here (it’s free).