Luxury casino and resort operator Monarch (NASDAQ: MCRI) met Wall Street’s revenue expectations in Q2 CY2026, with sales up 4.2% year on year to $142.6 million. Its GAAP profit of $1.78 per share was 7.3% above analysts’ consensus estimates.
Is now the time to buy Monarch? Find out by accessing our full research report, it’s free.
Monarch (MCRI) Q2 CY2026 Highlights:
- Revenue: $142.6 million vs analyst estimates of $142.6 million (4.2% year-on-year growth, in line)
- EPS (GAAP): $1.78 vs analyst estimates of $1.66 (7.3% beat)
- Adjusted EBITDA: $53 million vs analyst estimates of $53.36 million (37.2% margin, 0.7% miss)
- Operating Margin: 27.1%, up from 25.5% in the same quarter last year
- Market Capitalization: $2.21 billion
CEO CommentJohn Farahi, Co-Chairman and Chief Executive Officer of Monarch, commented: “Monarch delivered record second-quarter financial results. Second quarter net revenue increased 4.2% year-over-year reflecting growth in casino, F&B and hotel revenue. Adjusted EBITDA grew 3.3% compared to the same period last year. The second-quarter 2026 adjusted EBITDA margin remained near record levels at 37.2%, inclusive of a rise in employee benefit expenses, compared to 37.5% in Q2 2025. The second quarter revenue and adjusted EBITDA growth highlights our ability to drive sustained growth from our two properties.
Company Overview
Established in 1993, Monarch (NASDAQ: MCRI) operates luxury casinos and resorts, offering high-end gaming, dining, and hospitality experiences.
Revenue Growth
A company’s long-term performance is an indicator of its overall quality. Any business can have short-term success, but a top-tier one grows for years. Over the last five years, Monarch grew its sales at a 14.1% annual rate. Though this growth is acceptable on an absolute basis, we need to see more than just topline growth for the consumer discretionary sector, which can display significant earnings volatility. This means our bar for the sector is particularly high, reflecting the non-essential and hit-driven nature of the products and services offered. Additionally, five-year CAGR starts around Covid, when revenue was depressed then rebounded.
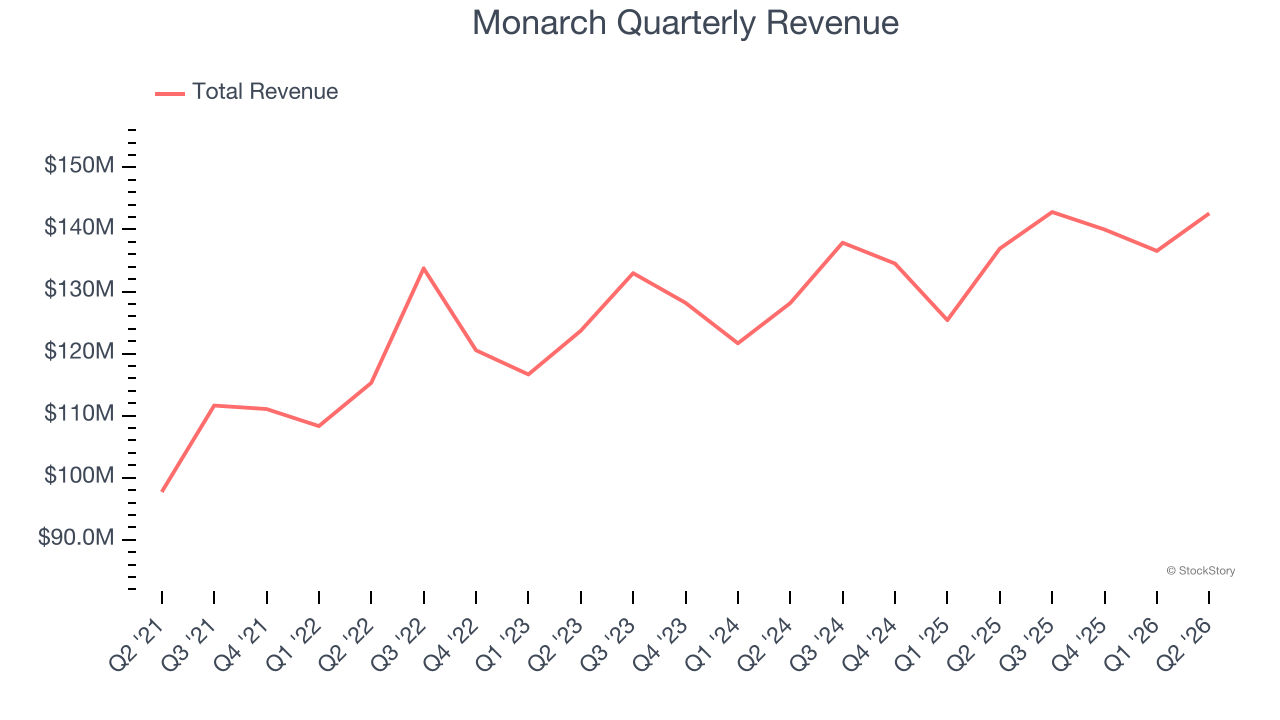
Long-term growth is the most important, but within consumer discretionary, product cycles are short and revenue can be hit-driven due to rapidly changing trends and consumer preferences. Monarch’s recent performance shows its demand has slowed as its annualized revenue growth of 4.9% over the last two years was below its five-year trend. We’re wary when companies in the sector see decelerations in revenue growth, as it could signal changing consumer tastes aided by low switching costs. Note that COVID hurt Monarch’s business in 2020 and part of 2021, and it bounced back in a big way thereafter. 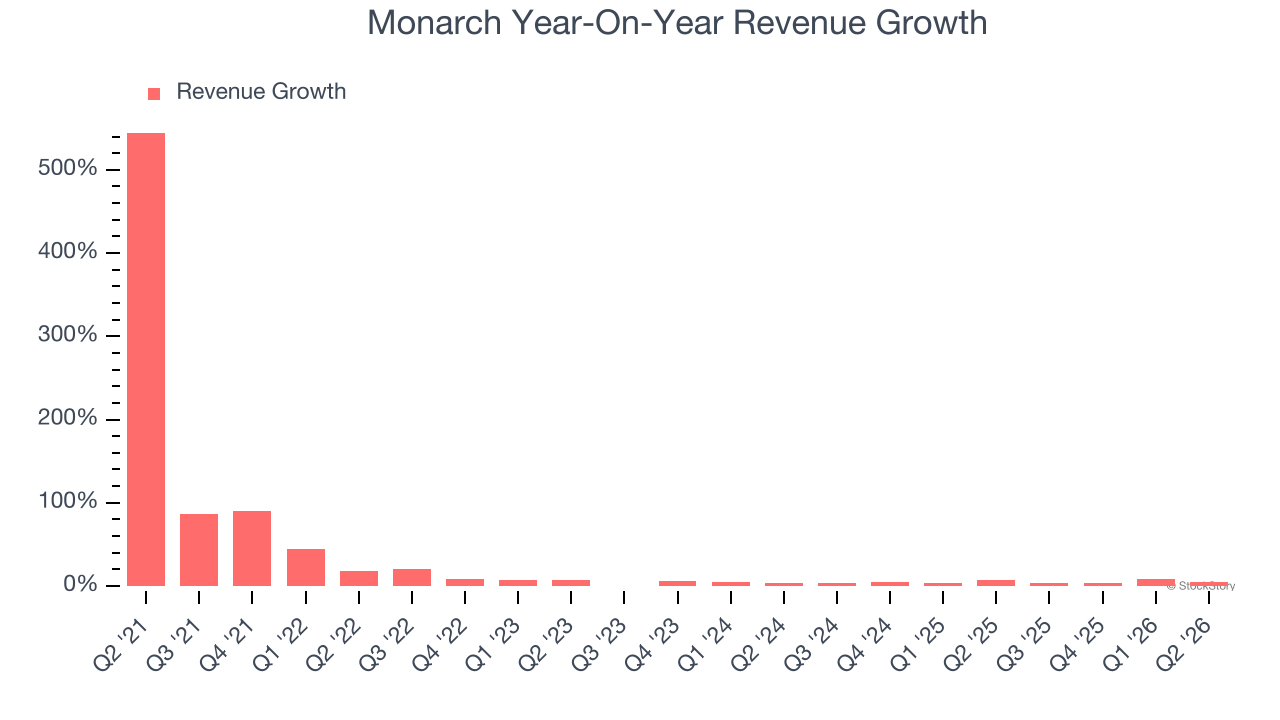
We can dig further into the company’s revenue dynamics by analyzing its most important segment, Casino. Over the last two years, Monarch’s Casino revenue (Poker, Blackjack) averaged 5.3% year-on-year growth. 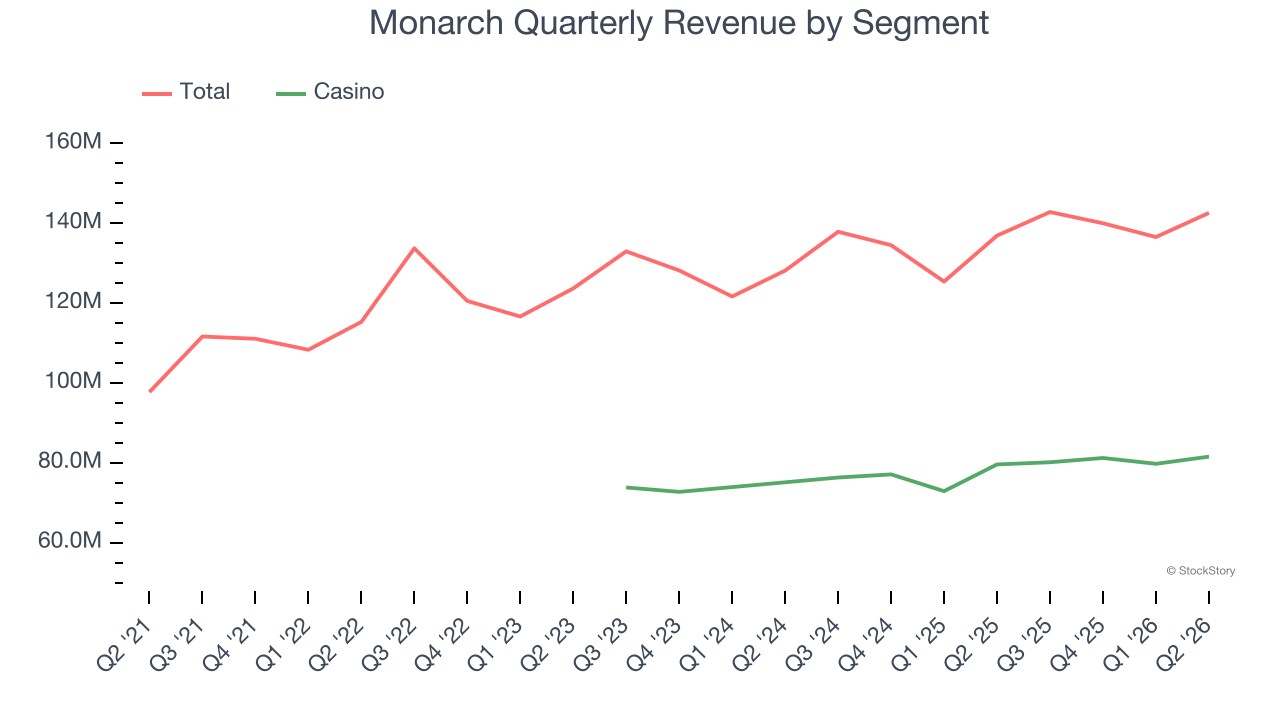
This quarter, Monarch grew its revenue by 4.2% year on year, and its $142.6 million of revenue was in line with Wall Street’s estimates.
Looking ahead, sell-side analysts expect revenue to grow 3.1% over the next 12 months, a slight deceleration versus the last two years. This projection doesn’t excite us and suggests its products and services will face some demand challenges.
WHILE YOU’RE HERE: The Next Palantir? One satellite company captures images of every point on Earth. Every single day. The Pentagon wants it. Hedge funds are using it to beat earnings. You’ve probably never heard of it.
This is what the early days of Palantir looked like before it became a giant. Same playbook. Different technology. If you missed Palantir, you need to see this. Claim The Stock Ticker for Free HERE.
Operating Margin
Monarch’s operating margin has risen over the last 12 months and averaged 21.9% over the last two years. The company’s higher efficiency is a breath of fresh air, but its suboptimal cost structure means it still sports lousy profitability for a consumer discretionary business.
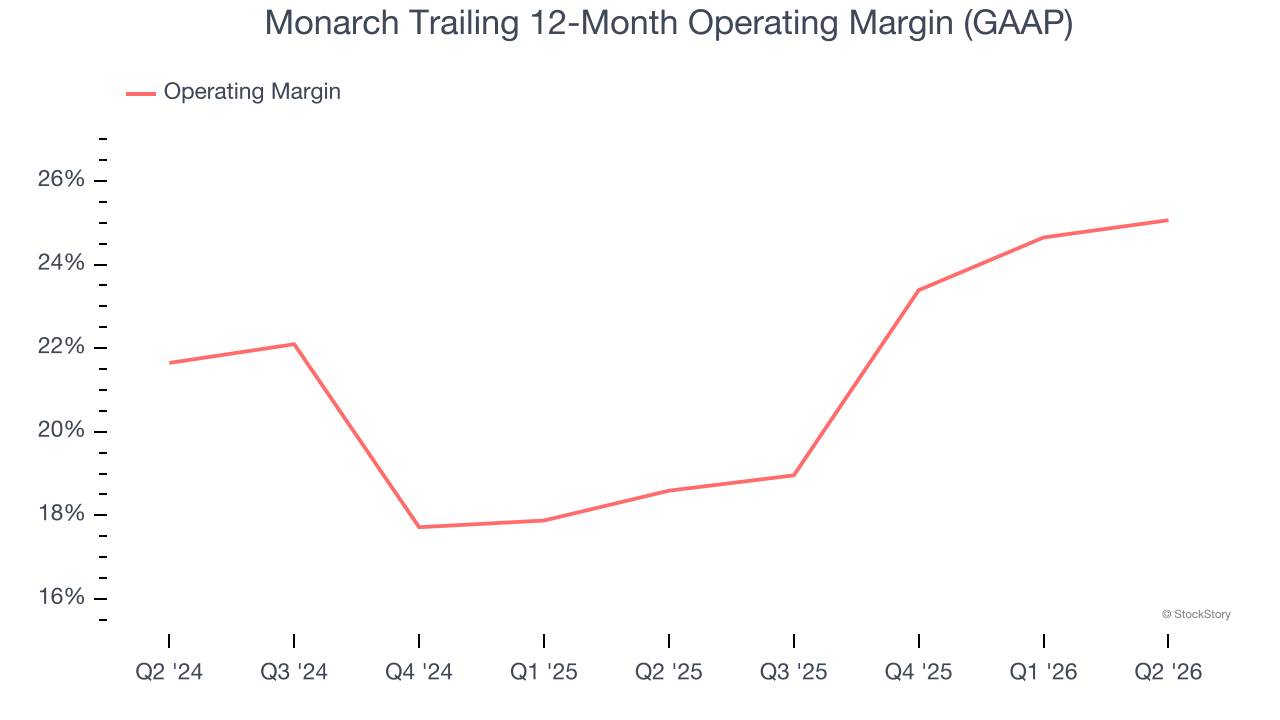
In Q2, Monarch generated an operating margin profit margin of 27.1%, up 1.6 percentage points year on year. This increase was a welcome development and shows it was more efficient.
Earnings Per Share
Revenue trends explain a company’s historical growth, but the long-term change in earnings per share (EPS) points to the profitability of that growth — for example, a company could inflate its sales through excessive spending on advertising and promotions.
Monarch’s EPS grew at 18% compounded annual growth rate over the last five years. On the bright side, this performance was better than its 14.1% annualized revenue growth and tells us the company became more profitable on a per-share basis as it expanded.
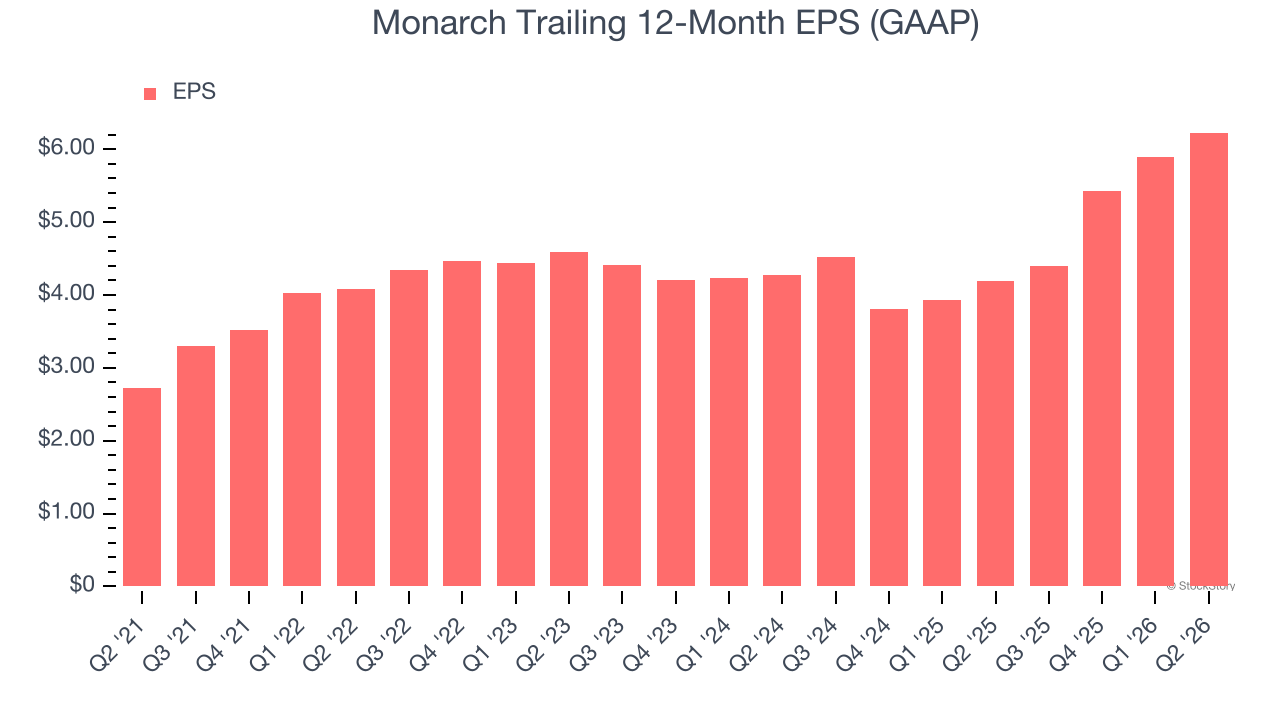
In Q2, Monarch reported EPS of $1.78, up from $1.44 in the same quarter last year. This print beat analysts’ estimates by 6.4%. Over the next 12 months, Wall Street expects Monarch’s full-year EPS to grow 8.2% from $6.23 to $6.74.
Key Takeaways from Monarch’s Q2 Results
It was good to see Monarch beat analysts’ EPS expectations this quarter. Zooming out, we think this was a decent quarter. The stock traded up 1.7% to $126.57 immediately following the results.
Is Monarch an attractive investment opportunity right now? If you’re making that decision, you should consider the bigger picture of valuation, business qualities, as well as the latest earnings. We cover that in our actionable full research report which you can read here (it’s free).