Medicine and manufacturing technology provider Novanta (NASDAQ: NOVT) announced better-than-expected revenue in Q1 CY2026, with sales up 10.4% year on year to $257.7 million. Guidance for next quarter’s revenue was better than expected at $261.5 million at the midpoint, 1.7% above analysts’ estimates. Its non-GAAP profit of $0.81 per share was 4.3% above analysts’ consensus estimates.
Is now the time to buy Novanta? Find out by accessing our full research report, it’s free.
Novanta (NOVT) Q1 CY2026 Highlights:
- Revenue: $257.7 million vs analyst estimates of $253.4 million (10.4% year-on-year growth, 1.7% beat)
- Adjusted EPS: $0.81 vs analyst estimates of $0.78 (4.3% beat)
- Adjusted EBITDA: $57.08 million vs analyst estimates of $57.12 million (22.1% margin, in line)
- Revenue Guidance for the full year is $1.05 billion at the midpoint, roughly in line with what analysts were expecting
- Adjusted EPS guidance for the full year is $3.58 at the midpoint, roughly in line with what analysts were expecting
- EBITDA guidance for the full year is $247.5 million at the midpoint, in line with analyst expectations
- Operating Margin: 10.7%, down from 12.8% in the same quarter last year
- Free Cash Flow Margin: 18.4%, up from 11.7% in the same quarter last year
- Market Capitalization: $4.93 billion
Company Overview
Originally a pioneer in the laser scanning industry during the late 1960s, Novanta (NASDAQ: NOVT) offers medicine and manufacturing technology to the medical, life sciences, and manufacturing industries.
Revenue Growth
A company’s long-term sales performance is one signal of its overall quality. Any business can have short-term success, but a top-tier one grows for years. Over the last five years, Novanta grew its sales at an impressive 10.9% compounded annual growth rate. Its growth beat the average industrials company and shows its offerings resonate with customers.
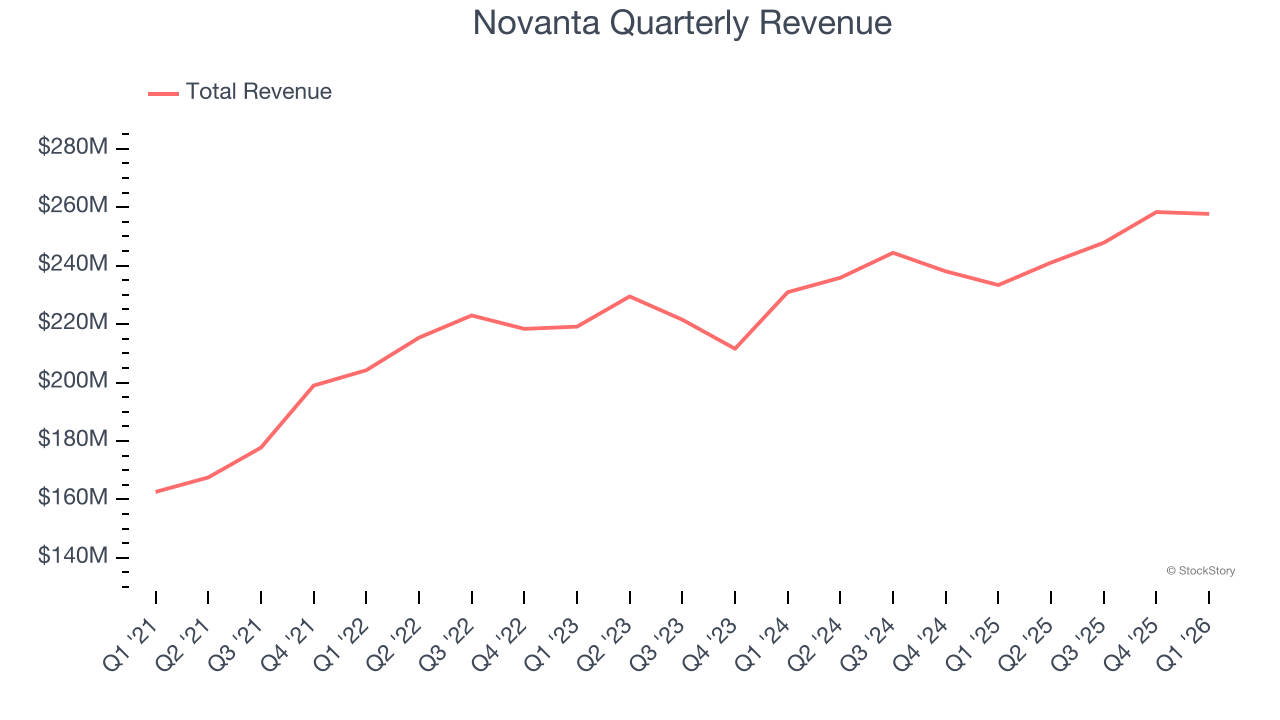
We at StockStory place the most emphasis on long-term growth, but within industrials, a half-decade historical view may miss cycles, industry trends, or a company capitalizing on catalysts such as a new contract win or a successful product line. Novanta’s recent performance shows its demand has slowed significantly as its annualized revenue growth of 6.1% over the last two years was well below its five-year trend. 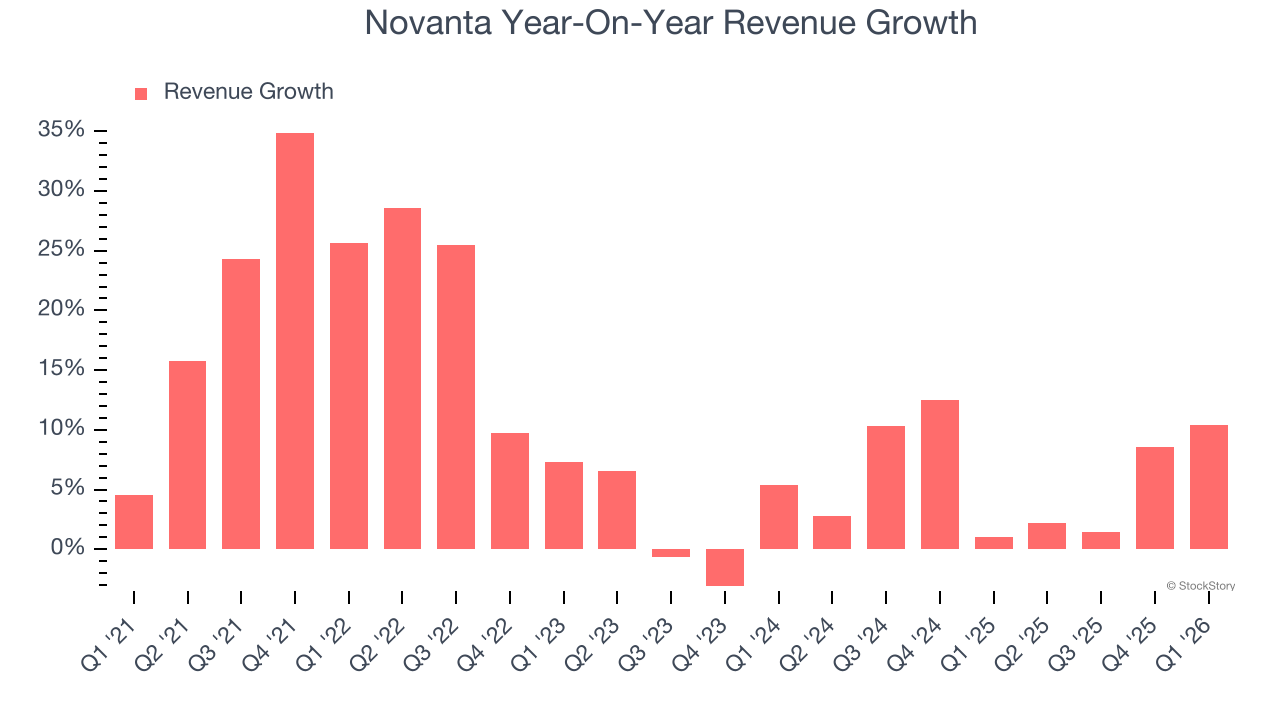
This quarter, Novanta reported year-on-year revenue growth of 10.4%, and its $257.7 million of revenue exceeded Wall Street’s estimates by 1.7%. Company management is currently guiding for a 8.5% year-on-year increase in sales next quarter.
Looking further ahead, sell-side analysts expect revenue to grow 5.9% over the next 12 months, similar to its two-year rate. This projection doesn't excite us and indicates its newer products and services will not catalyze better top-line performance yet.
ONE MORE THING: 3 Hidden Platforms Growing 3X Faster than Amazon, Google, and PayPal. Amazon, Google, and Meta all followed the same playbook: Dominate an ignored market. Build an unbeatable moat. Scale until you’re unstoppable.
These three platforms are running that exact playbook right now. The early investors in Amazon made fortunes. The early investors in these could do the same. Get All 3 Stocks Here for FREE.
Operating Margin
Operating margin is one of the best measures of profitability because it tells us how much money a company takes home after procuring and manufacturing its products, marketing and selling those products, and most importantly, keeping them relevant through research and development.
Novanta’s operating margin has generally stayed the same over the last 12 months, averaging 12.5% over the last five years. This profitability was top-notch for an industrials business, showing it’s an well-run company with an efficient cost structure. This result isn’t surprising as its high gross margin gives it a favorable starting point.
Looking at the trend in its profitability, Novanta’s operating margin might fluctuated slightly but has generally stayed the same over the last five years. This raises questions about the company’s expense base because its revenue growth should have given it leverage on its fixed costs, resulting in better economies of scale and profitability.
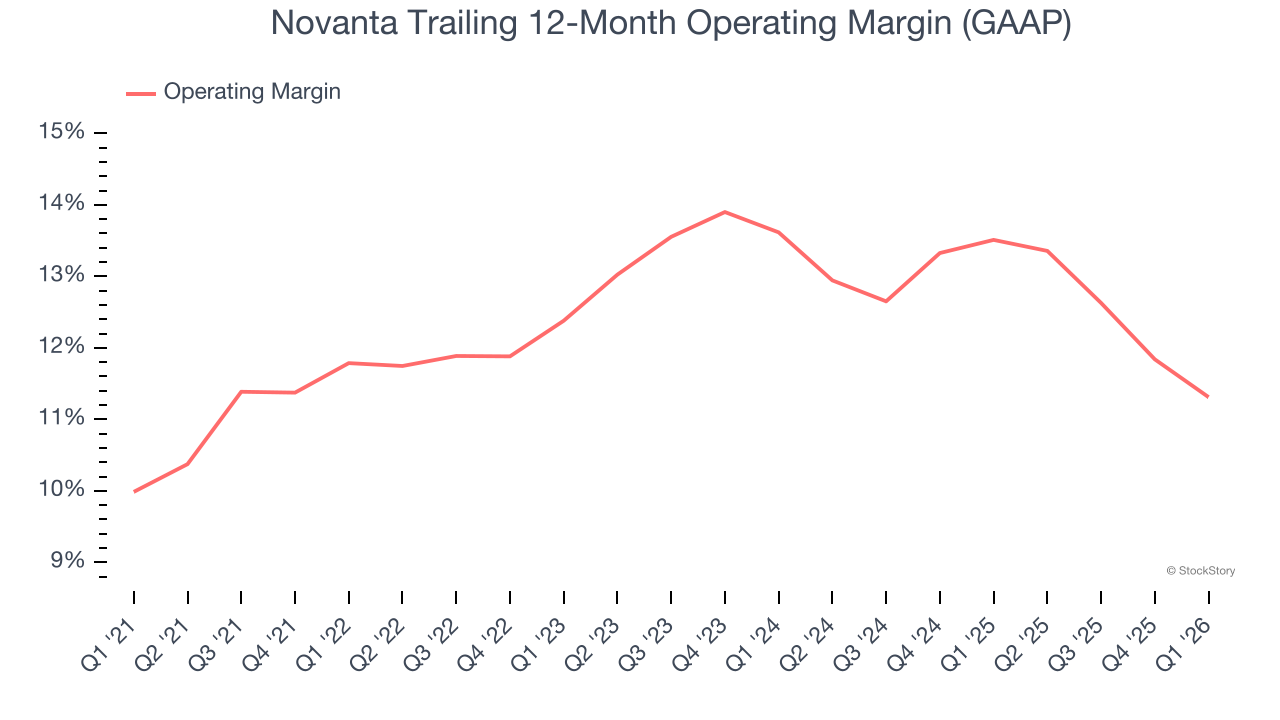
This quarter, Novanta generated an operating margin profit margin of 10.7%, down 2.2 percentage points year on year. Since Novanta’s operating margin decreased more than its gross margin, we can assume it was less efficient because expenses such as marketing, R&D, and administrative overhead increased.
Earnings Per Share
Revenue trends explain a company’s historical growth, but the long-term change in earnings per share (EPS) points to the profitability of that growth – for example, a company could inflate its sales through excessive spending on advertising and promotions.
Novanta’s solid 10.8% annual EPS growth over the last five years aligns with its revenue performance. This tells us its incremental sales were profitable.
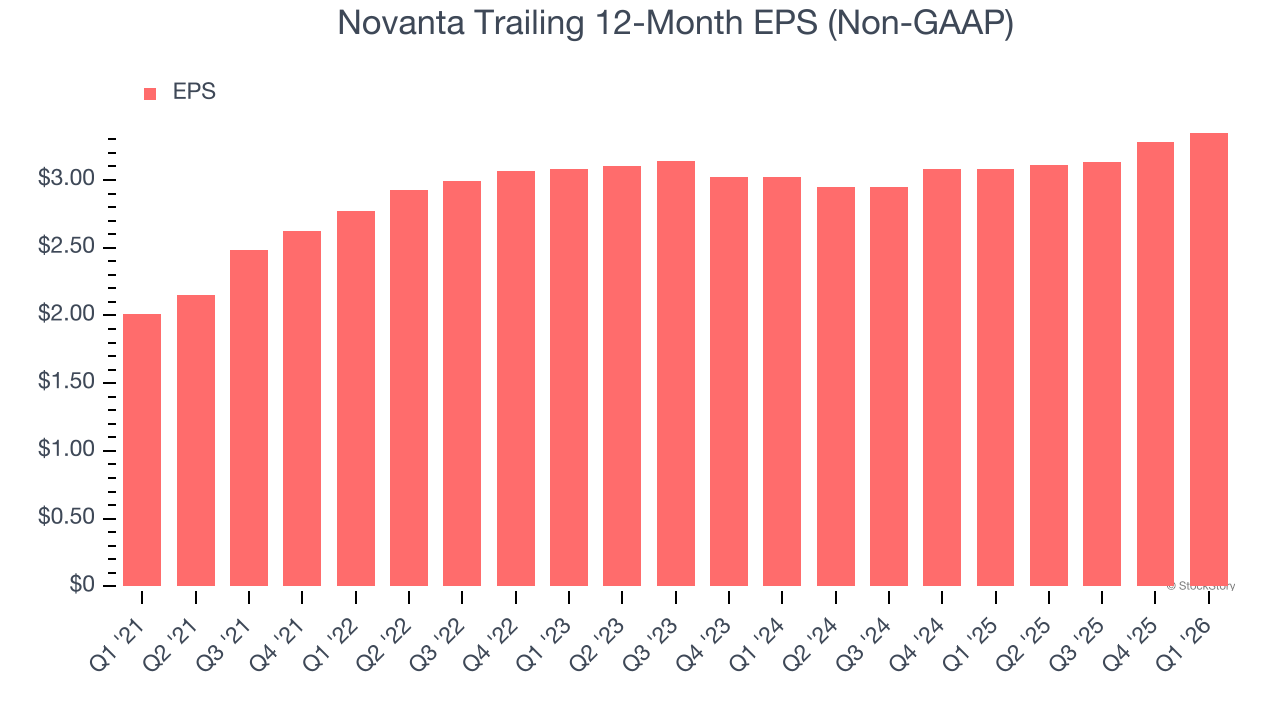
Like with revenue, we analyze EPS over a more recent period because it can provide insight into an emerging theme or development for the business.
For Novanta, its two-year annual EPS growth of 5.3% was lower than its five-year trend. We hope its growth can accelerate in the future.
In Q1, Novanta reported adjusted EPS of $0.81, up from $0.74 in the same quarter last year. This print beat analysts’ estimates by 4.3%. We also like to analyze expected EPS growth based on Wall Street analysts’ consensus projections, but there is insufficient data.
Key Takeaways from Novanta’s Q1 Results
It was encouraging to see Novanta beat analysts’ revenue expectations this quarter. We were also glad its revenue guidance for next quarter exceeded Wall Street’s estimates. On the other hand, its adjusted operating income missed and its EBITDA guidance for next quarter fell short of Wall Street’s estimates. Overall, this was a softer quarter. The stock remained flat at $140.41 immediately following the results.
Big picture, is Novanta a buy here and now? If you’re making that decision, you should consider the bigger picture of valuation, business qualities, as well as the latest earnings. We cover that in our actionable full research report which you can read here (it’s free).