
Transportation company Schneider (NYSE: SNDR) missed Wall Street’s revenue expectations in Q1 CY2026, with sales flat year on year at $1.40 billion. Its non-GAAP profit of $0.12 per share was 22.9% above analysts’ consensus estimates.
Is now the time to buy Schneider? Find out by accessing our full research report, it’s free.
Schneider (SNDR) Q1 CY2026 Highlights:
- Revenue: $1.40 billion vs analyst estimates of $1.41 billion (flat year on year, 0.7% miss)
- Adjusted EPS: $0.12 vs analyst estimates of $0.10 (22.9% beat)
- Adjusted EBITDA: $143.6 million vs analyst estimates of $142.5 million (10.3% margin, 0.8% beat)
- Management reiterated its full-year Adjusted EPS guidance of $0.85 at the midpoint
- Operating Margin: 2.4%, in line with the same quarter last year
- Free Cash Flow was $48.1 million, up from -$5.4 million in the same quarter last year
- Market Capitalization: $5.32 billion
Company Overview
Employing thousands of drivers across the country to make deliveries, Schneider (NYSE: SNDR) makes full truckload and intermodal deliveries regionally and across borders.
Revenue Growth
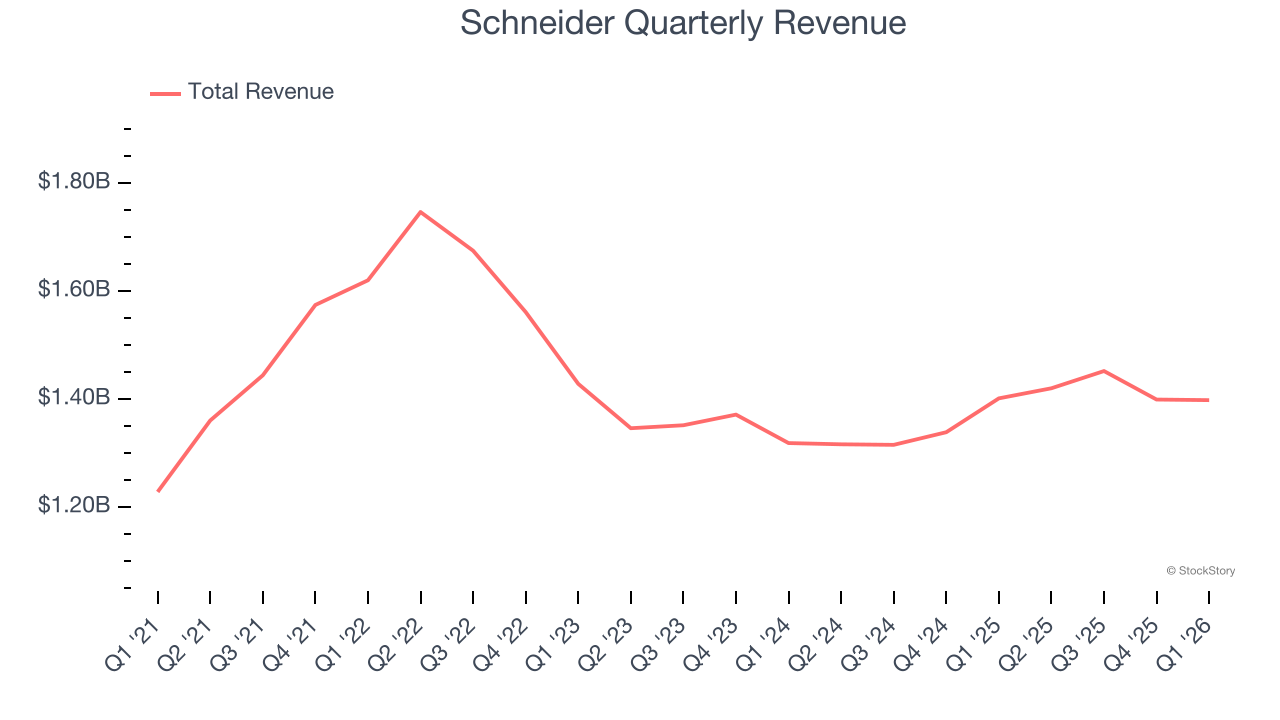
Examining a company’s long-term performance can provide clues about its quality. Any business can put up a good quarter or two, but many enduring ones grow for years. Regrettably, Schneider’s sales grew at a sluggish 4% compounded annual growth rate over the last five years. This was below our standard for the industrials sector and is a rough starting point for our analysis.
Long-term growth is the most important, but within industrials, a half-decade historical view may miss new industry trends or demand cycles. Schneider’s recent performance shows its demand has slowed as its annualized revenue growth of 2.6% over the last two years was below its five-year trend. We’re wary when companies in the sector see decelerations in revenue growth, as it could signal changing consumer tastes aided by low switching costs. 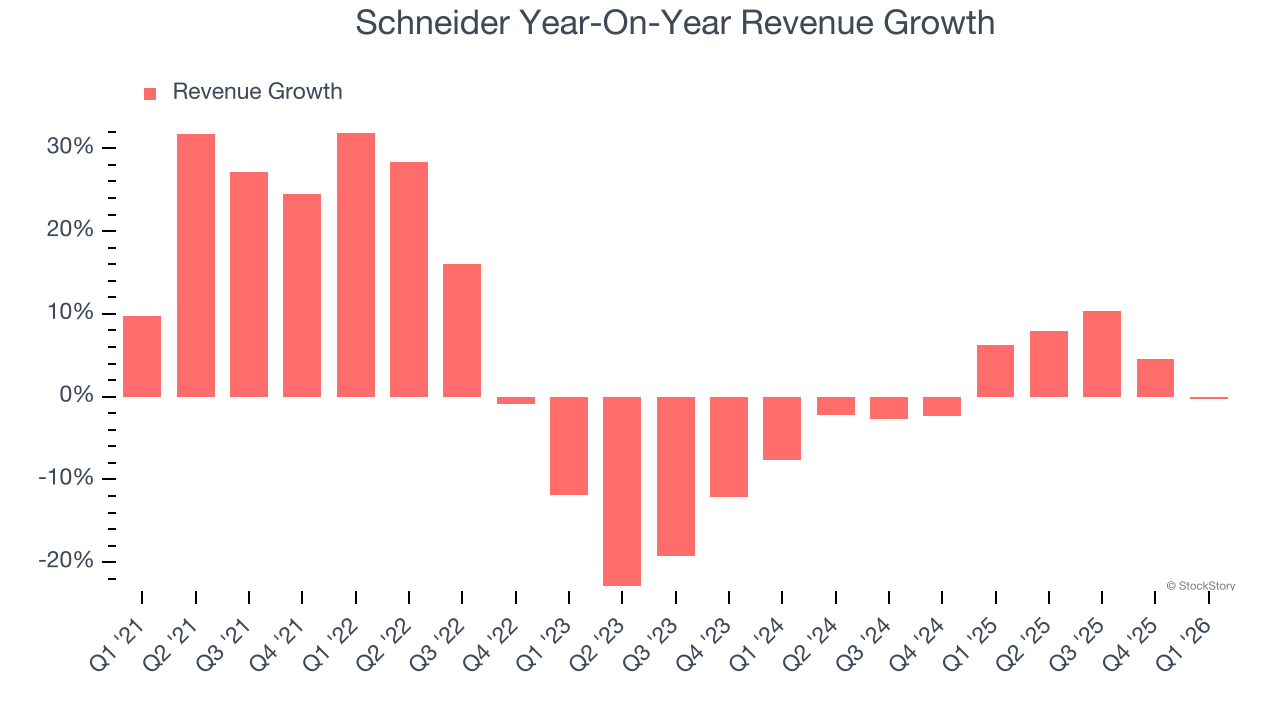
We can dig further into the company’s revenue dynamics by analyzing its most important segments, Truckload
and Logistics, which are 44.2% and 22.3% of revenue. Over the last two years, Schneider’s Truckload
revenue (road freight) averaged 11.2% year-on-year growth while its Logistics revenue (supply chain, warehousing) averaged 2.1% growth. 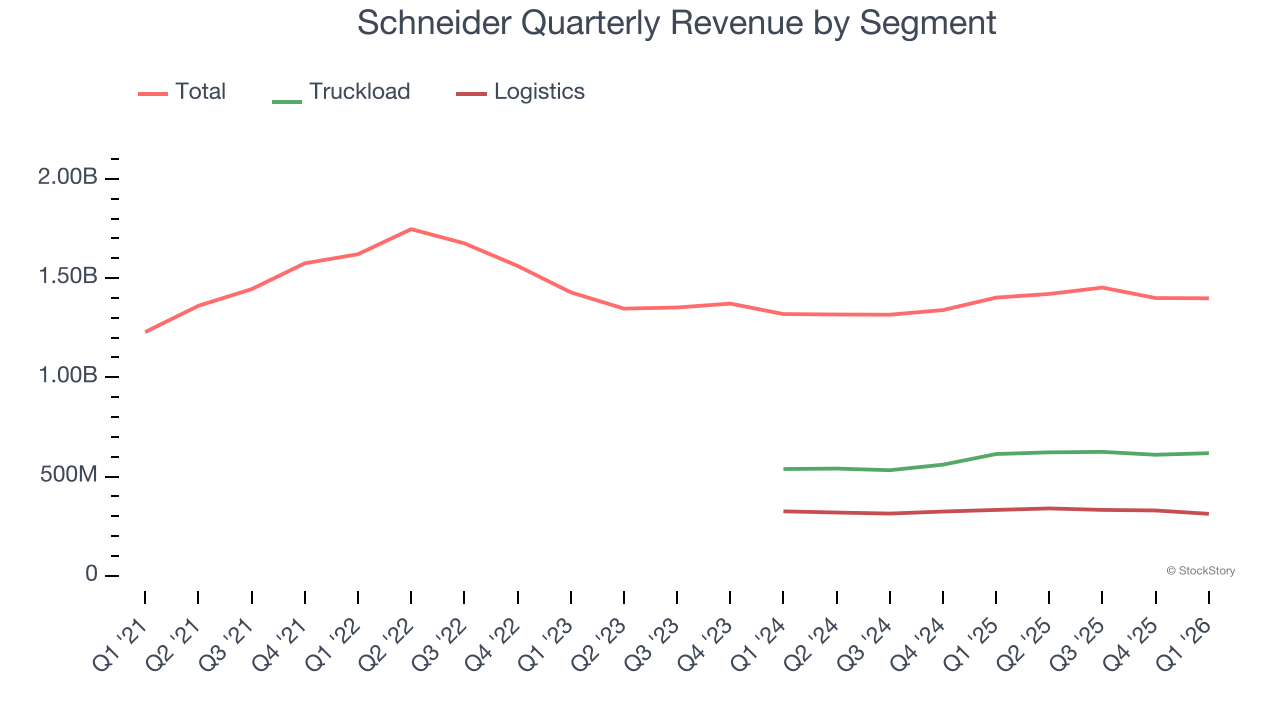
This quarter, Schneider missed Wall Street’s estimates and reported a rather uninspiring 0.2% year-on-year revenue decline, generating $1.40 billion of revenue.
Looking ahead, sell-side analysts expect revenue to grow 6.7% over the next 12 months. Although this projection implies its newer products and services will fuel better top-line performance, it is still below average for the sector.
WHILE YOU’RE HERE: The Next Palantir? One satellite company captures images of every point on Earth. Every single day. The Pentagon wants it. Hedge funds are using it to beat earnings. You’ve probably never heard of it.
This is what the early days of Palantir looked like before it became a $437 billion giant. Same playbook. Different technology. If you missed Palantir, you need to see this. Claim The Stock Ticker for Free HERE.
Operating Margin
Schneider was profitable over the last five years but held back by its large cost base. Its average operating margin of 6% was weak for an industrials business. This result isn’t too surprising given its low gross margin as a starting point.
Analyzing the trend in its profitability, Schneider’s operating margin decreased by 7.1 percentage points over the last five years. This raises questions about the company’s expense base because its revenue growth should have given it leverage on its fixed costs, resulting in better economies of scale and profitability. Schneider’s performance was poor no matter how you look at it - it shows that costs were rising and it couldn’t pass them onto its customers.
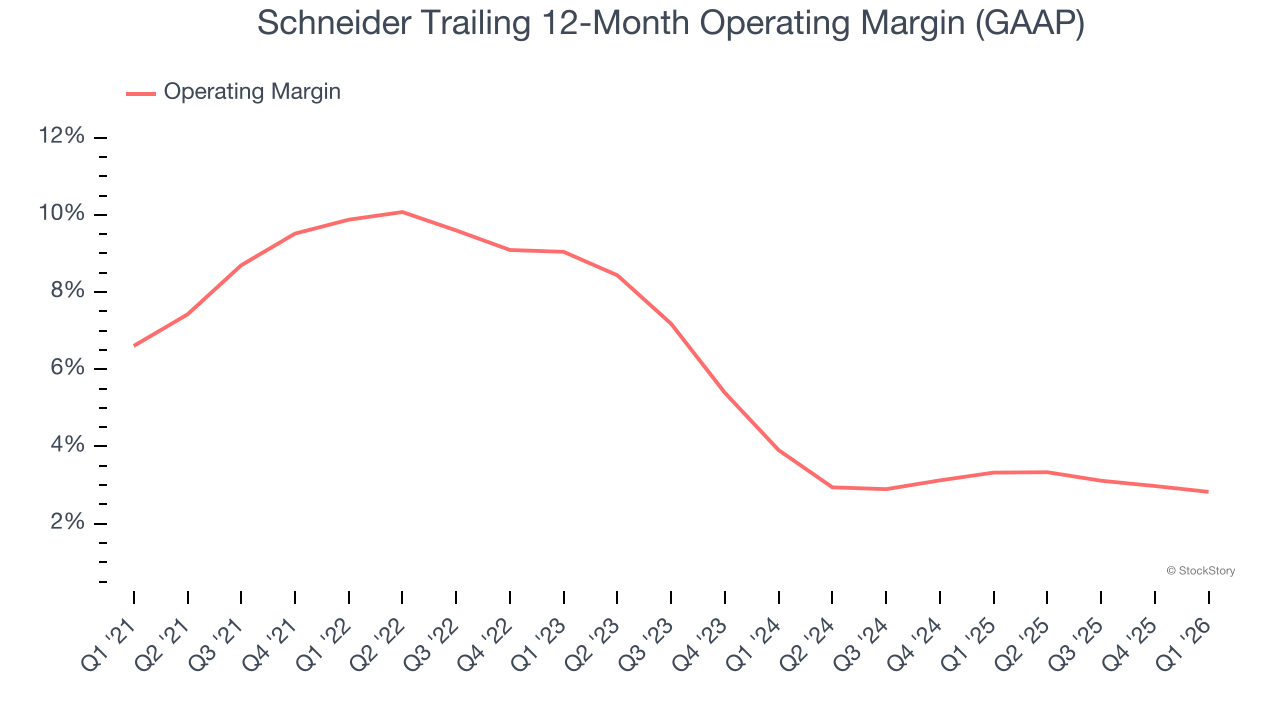
In Q1, Schneider generated an operating margin profit margin of 2.4%, in line with the same quarter last year. This indicates the company’s cost structure has recently been stable.
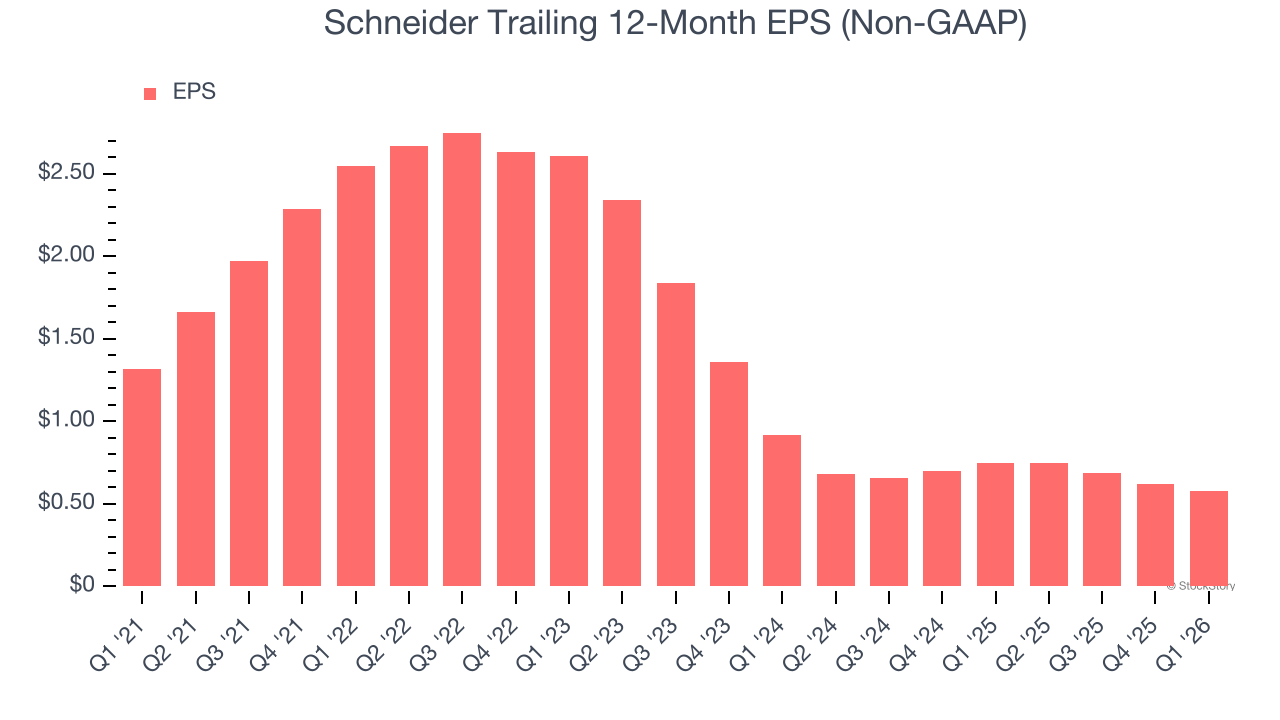
Earnings Per Share
We track the long-term change in earnings per share (EPS) for the same reason as long-term revenue growth. Compared to revenue, however, EPS highlights whether a company’s growth is profitable.
Sadly for Schneider, its EPS declined by 15.2% annually over the last five years while its revenue grew by 4%. This tells us the company became less profitable on a per-share basis as it expanded due to non-fundamental factors such as interest expenses and taxes.
Diving into the nuances of Schneider’s earnings can give us a better understanding of its performance. As we mentioned earlier, Schneider’s operating margin was flat this quarter but declined by 7.1 percentage points over the last five years. This was the most relevant factor (aside from the revenue impact) behind its lower earnings; interest expenses and taxes can also affect EPS but don’t tell us as much about a company’s fundamentals.
Like with revenue, we analyze EPS over a more recent period because it can provide insight into an emerging theme or development for the business.
For Schneider, its two-year annual EPS declines of 20.6% show it’s continued to underperform. These results were bad no matter how you slice the data.
In Q1, Schneider reported adjusted EPS of $0.12, down from $0.16 in the same quarter last year. Despite falling year on year, this print easily cleared analysts’ estimates. Over the next 12 months, Wall Street expects Schneider’s full-year EPS of $0.58 to grow 71.4%.
Key Takeaways from Schneider’s Q1 Results
We were impressed by how significantly Schneider blew past analysts’ adjusted operating income expectations this quarter. We were also glad its EPS outperformed Wall Street’s estimates. On the other hand, its revenue slightly missed. Overall, we think this was a decent quarter with some key metrics above expectations. The stock remained flat at $31.00 immediately after reporting.
Is Schneider an attractive investment opportunity at the current price? We think that the latest quarter is only one piece of the longer-term business quality puzzle. Quality, when combined with valuation, can help determine if the stock is a buy. We cover that in our actionable full research report which you can read here (it’s free).