
Flooring manufacturer Mohawk Industries (NYSE: MHK) missed Wall Street’s revenue expectations in Q1 CY2026, but sales rose 8% year on year to $2.73 billion. Its non-GAAP profit of $1.90 per share was 4.8% above analysts’ consensus estimates.
Is now the time to buy Mohawk Industries? Find out by accessing our full research report, it’s free.
Mohawk Industries (MHK) Q1 CY2026 Highlights:
- Revenue: $2.73 billion vs analyst estimates of $2.74 billion (8% year-on-year growth, 0.5% miss)
- Adjusted EPS: $1.90 vs analyst estimates of $1.81 (4.8% beat)
- Adjusted EBITDA: $299.8 million vs analyst estimates of $296.4 million (11% margin, 1.1% beat)
- Adjusted EPS guidance for Q2 CY2026 is $2.55 at the midpoint, below analyst estimates of $2.73
- Operating Margin: 4.1%, in line with the same quarter last year
- Free Cash Flow was $7.8 million, up from -$85.4 million in the same quarter last year
- Market Capitalization: $6.30 billion
Commenting on the Company’s first quarter, Chairman and CEO Jeff Lorberbaum stated, “Our performance was in line with our expectations despite a challenging environment. Our results include benefits from productivity, restructuring and product mix, offset by inflation and volume. Last year was impacted by the system conversion and had four fewer days. Across our regions, the commercial sector continued to outperform residential. New home construction remained soft, and consumers continued to defer home purchases and remodeling projects due to economic uncertainty. We are implementing productivity actions and executing our previously announced restructuring projects to enhance our results. During the quarter, we repurchased 607,000 shares of our stock for $64 million as part of our current stock buyback authorization. Our strong balance sheet provides strategic and operational flexibility to take advantages of opportunities that arise.
Company Overview
Established in 1878, Mohawk Industries (NYSE: MHK) is a leading producer of floor-covering products for both residential and commercial applications.
Revenue Growth
A company’s long-term sales performance can indicate its overall quality. Any business can have short-term success, but a top-tier one grows for years. Unfortunately, Mohawk Industries’s 2% annualized revenue growth over the last five years was weak. This was below our standards and is a rough starting point for our analysis.
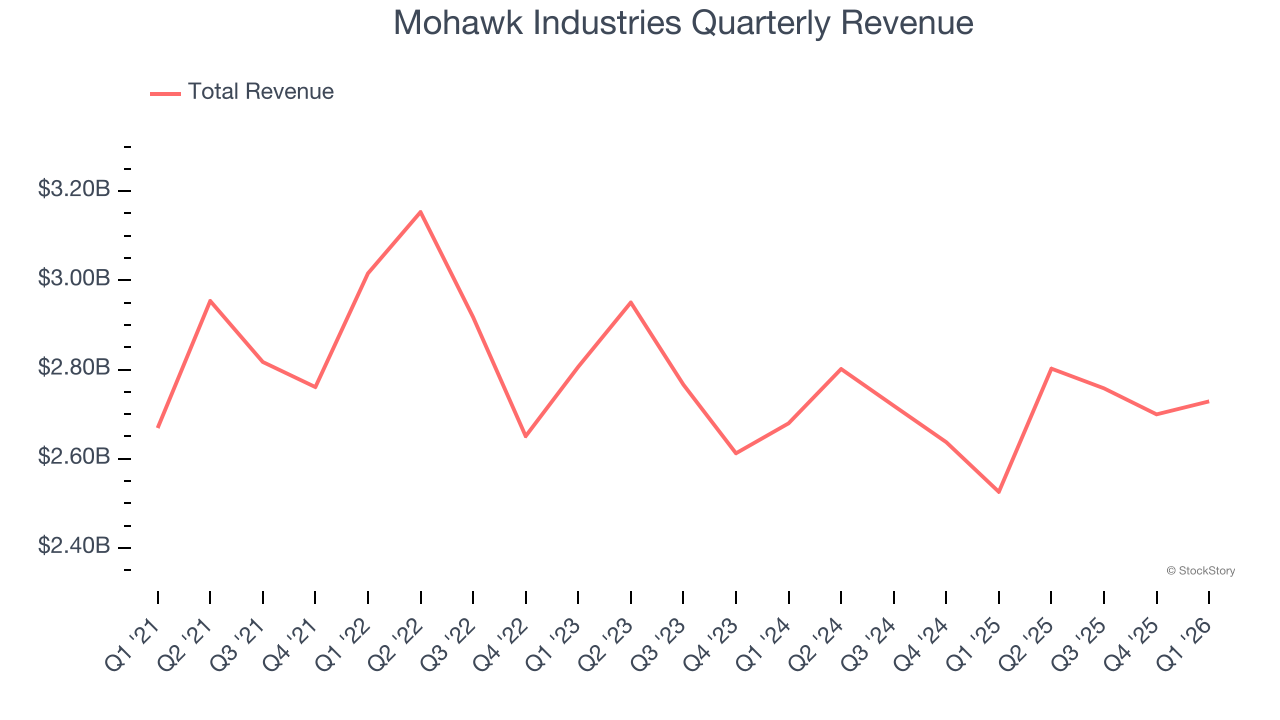
We at StockStory place the most emphasis on long-term growth, but within consumer discretionary, a stretched historical view may miss a company riding a successful new product or trend. Mohawk Industries’s recent performance shows its demand has slowed as its revenue was flat over the last two years. 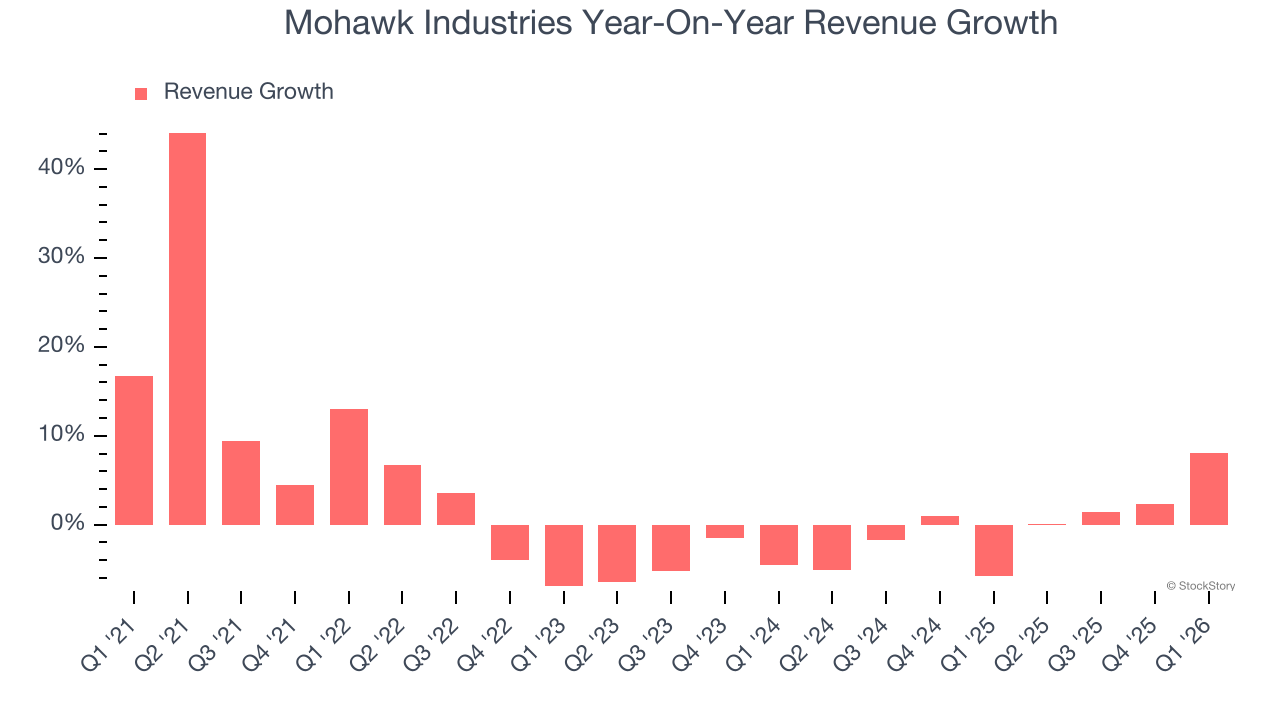
This quarter, Mohawk Industries’s revenue grew by 8% year on year to $2.73 billion, missing Wall Street’s estimates.
Looking ahead, sell-side analysts expect revenue to remain flat over the next 12 months. Although this projection indicates its newer products and services will spur better top-line performance, it is still below average for the sector.
WHILE YOU’RE HERE: The Next Palantir? One satellite company captures images of every point on Earth. Every single day. The Pentagon wants it. Hedge funds are using it to beat earnings. You’ve probably never heard of it.
This is what the early days of Palantir looked like before it became a $437 billion giant. Same playbook. Different technology. If you missed Palantir, you need to see this. Claim The Stock Ticker for Free HERE.
Operating Margin
Operating margin is an important measure of profitability as it shows the portion of revenue left after accounting for all core expenses – everything from the cost of goods sold to advertising and wages. It’s also useful for comparing profitability across companies with different levels of debt and tax rates because it excludes interest and taxes.
Mohawk Industries’s operating margin has been trending down over the last 12 months and averaged 5.3% over the last two years. The company’s profitability was mediocre for a consumer discretionary business and shows it couldn’t pass its higher operating expenses onto its customers.
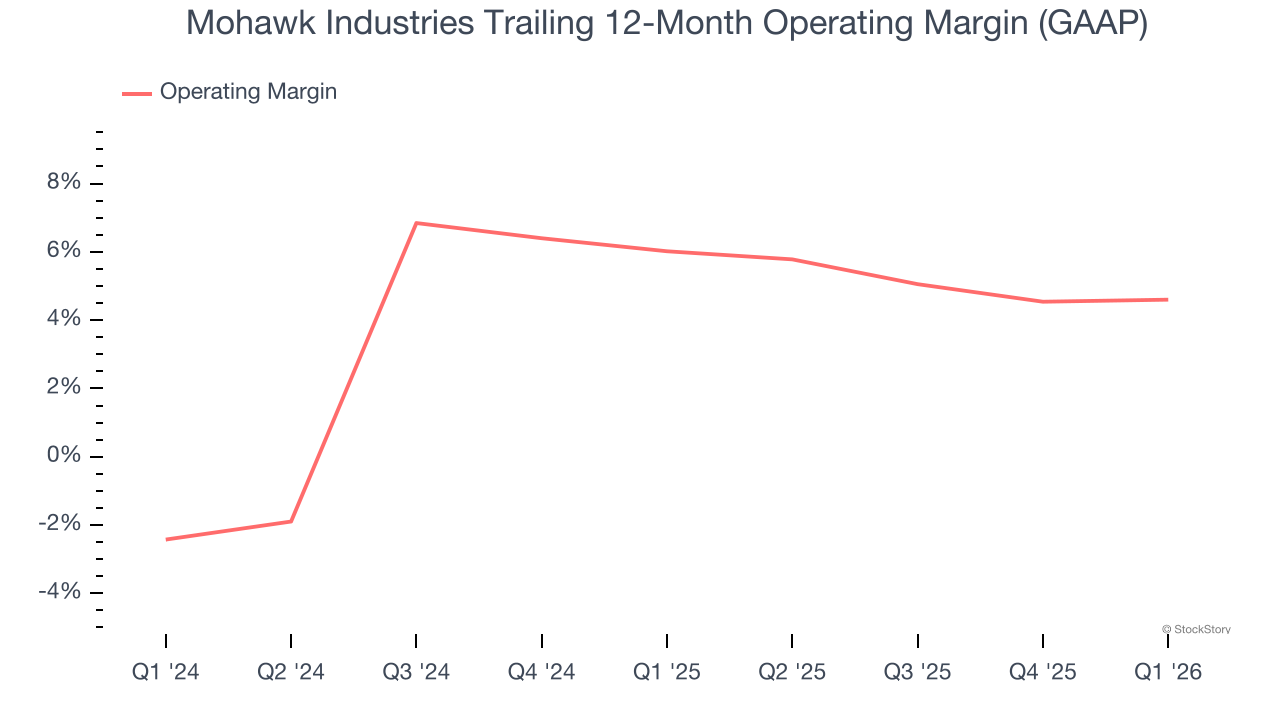
In Q1, Mohawk Industries generated an operating margin profit margin of 4.1%, in line with the same quarter last year. This indicates the company’s overall cost structure has been relatively stable.
Earnings Per Share
We track the long-term change in earnings per share (EPS) for the same reason as long-term revenue growth. Compared to revenue, however, EPS highlights whether a company’s growth is profitable.
Sadly for Mohawk Industries, its EPS declined by 2.6% annually over the last five years while its revenue grew by 2%. This tells us the company became less profitable on a per-share basis as it expanded due to non-fundamental factors such as interest expenses and taxes.
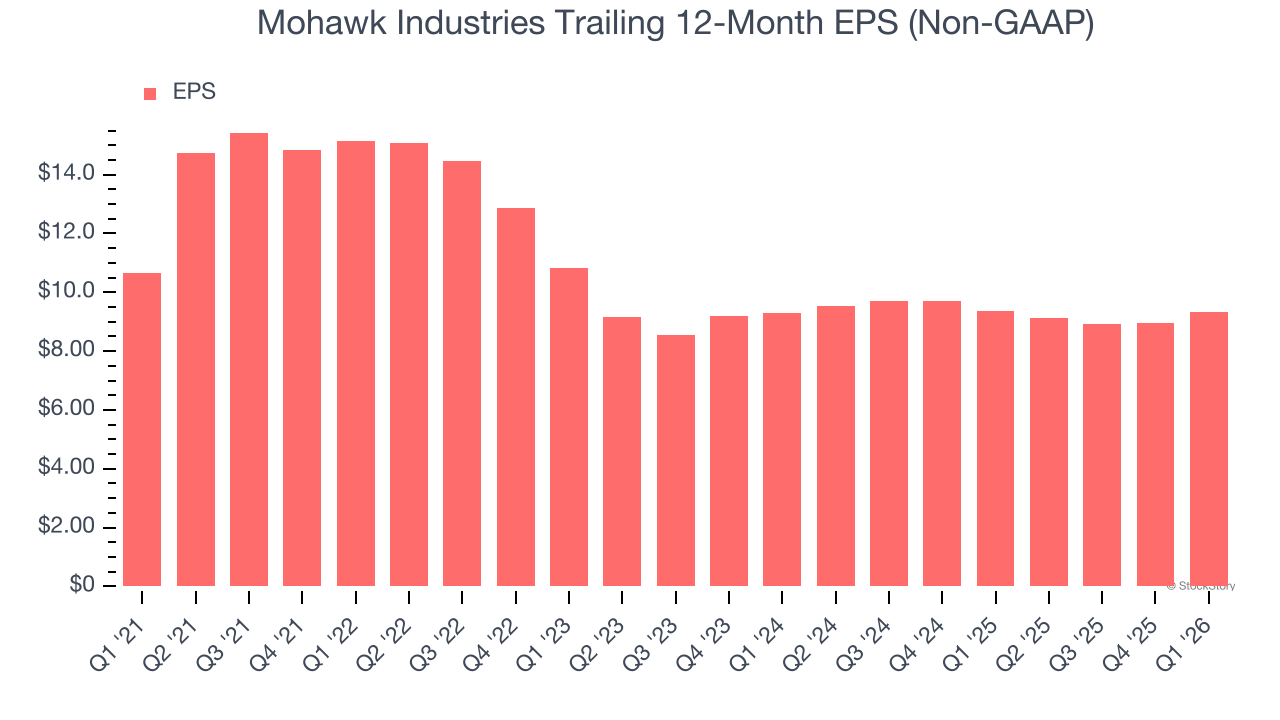
In Q1, Mohawk Industries reported adjusted EPS of $1.90, up from $1.52 in the same quarter last year. This print beat analysts’ estimates by 4.8%. Over the next 12 months, Wall Street expects Mohawk Industries’s full-year EPS of $9.34 to stay about the same.
Key Takeaways from Mohawk Industries’s Q1 Results
It was good to see Mohawk Industries beat analysts’ EPS expectations this quarter. On the other hand, its adjusted operating income missed and its EPS guidance for next quarter fell short of Wall Street’s estimates. Overall, this was a weaker quarter. The stock traded up 3.8% to $109.61 immediately following the results.
Is Mohawk Industries an attractive investment opportunity at the current price? When making that decision, it’s important to consider its valuation, business qualities, as well as what has happened in the latest quarter. We cover that in our actionable full research report which you can read here (it’s free).


