HR outsourcing provider Insperity (NYSE: NSP) met Wall Street’s revenue expectations in Q1 CY2026, with sales up 1.7% year on year to $1.9 billion. Its non-GAAP profit of $1.31 per share was 6.2% above analysts’ consensus estimates.
Is now the time to buy Insperity? Find out by accessing our full research report, it’s free.
Insperity (NSP) Q1 CY2026 Highlights:
- Revenue: $1.9 billion vs analyst estimates of $1.9 billion (1.7% year-on-year growth, in line)
- Adjusted EPS: $1.31 vs analyst estimates of $1.23 (6.2% beat)
- Adjusted EBITDA: $103 million vs analyst estimates of $92.48 million (5.4% margin, 11.4% beat)
- Management lowered its full-year Adjusted EPS guidance to $2.10 at the midpoint, a 4.8% decrease
- EBITDA guidance for the full year is $200 million at the midpoint, above analyst estimates of $193.6 million
- Operating Margin: 3.3%, in line with the same quarter last year
- Market Capitalization: $1.42 billion
“We are pleased with our Q1 financial results, which reflect the effectiveness of our efforts to overcome margin pressure experienced in 2025,” said Paul J. Sarvadi, Insperity chairman and chief executive officer.
Company Overview
Pioneering the professional employer organization (PEO) industry it helped establish, Insperity (NYSE: NSP) provides human resources outsourcing services to small and medium-sized businesses, handling payroll, benefits, compliance, and HR administration.
Revenue Growth
Reviewing a company’s long-term sales performance reveals insights into its quality. Even a bad business can shine for one or two quarters, but a top-tier one grows for years.
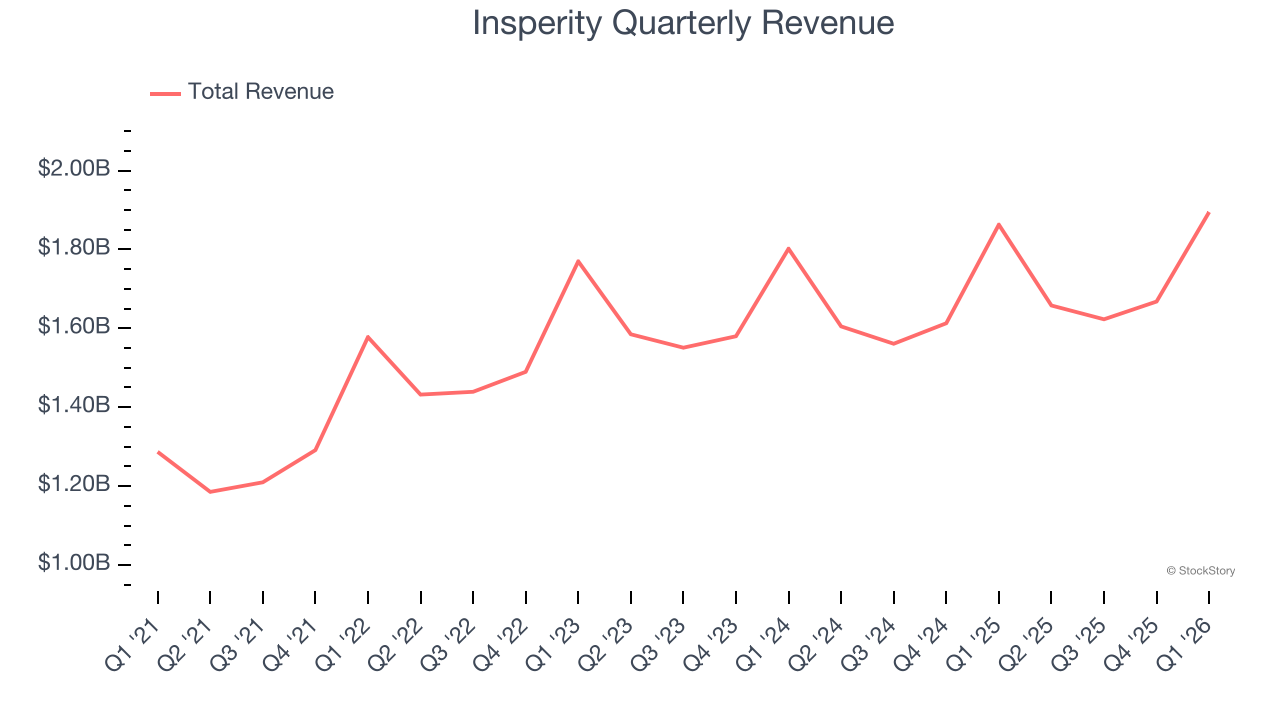
With $6.84 billion in revenue over the past 12 months, Insperity is one of the larger companies in the business services industry and benefits from a well-known brand that influences purchasing decisions.
As you can see below, Insperity’s 9.5% annualized revenue growth over the last five years was impressive. This shows it had high demand, a useful starting point for our analysis.
Long-term growth is the most important, but within business services, a half-decade historical view may miss new innovations or demand cycles. Insperity’s recent performance shows its demand has slowed significantly as its annualized revenue growth of 2.5% over the last two years was well below its five-year trend. 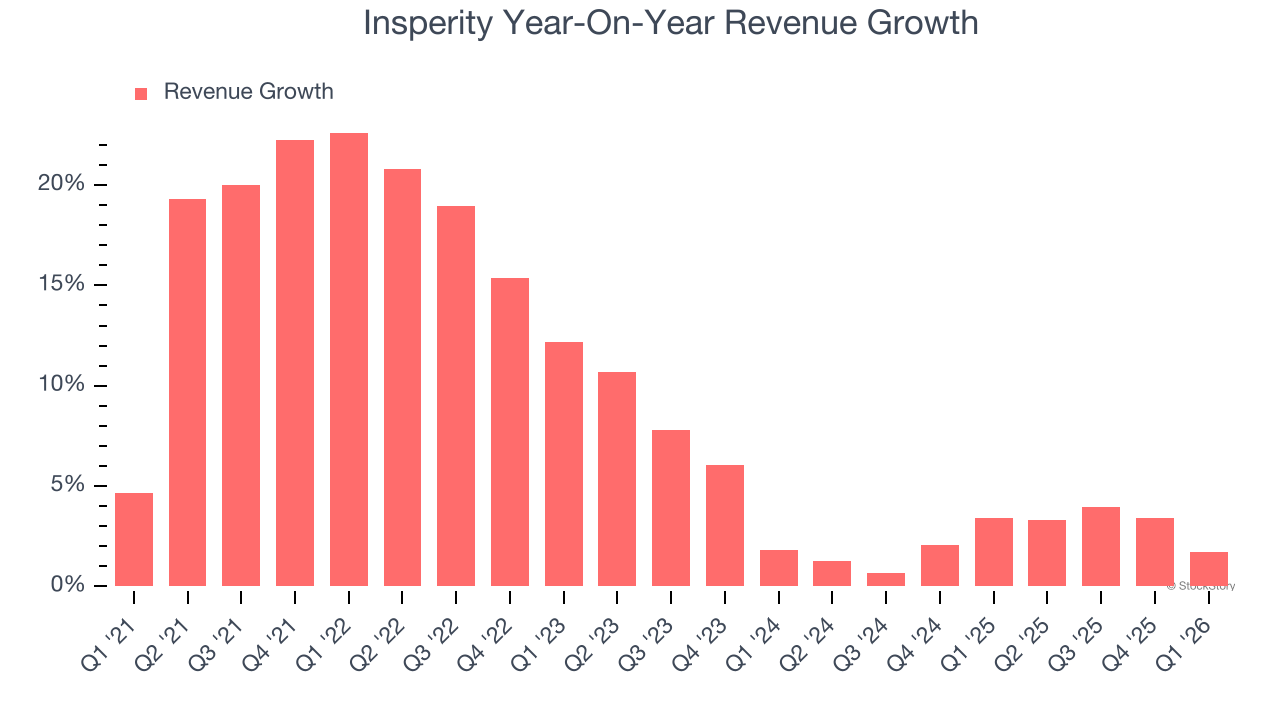
This quarter, Insperity grew its revenue by 1.7% year on year, and its $1.9 billion of revenue was in line with Wall Street’s estimates.
Looking ahead, sell-side analysts expect revenue to grow 3.9% over the next 12 months, similar to its two-year rate. While this projection indicates its newer products and services will fuel better top-line performance, it is still below the sector average.
WHILE YOU’RE HERE: The Next Palantir? One satellite company captures images of every point on Earth. Every single day. The Pentagon wants it. Hedge funds are using it to beat earnings. You’ve probably never heard of it.
This is what the early days of Palantir looked like before it became a $437 billion giant. Same playbook. Different technology. If you missed Palantir, you need to see this. Claim The Stock Ticker for Free HERE.
Adjusted Operating Margin
Insperity was profitable over the last five years but held back by its large cost base. Its average adjusted operating margin of 3.2% was weak for a business services business.
Analyzing the trend in its profitability, Insperity’s adjusted operating margin decreased by 3.6 percentage points over the last five years. This raises questions about the company’s expense base because its revenue growth should have given it leverage on its fixed costs, resulting in better economies of scale and profitability. Insperity’s performance was poor no matter how you look at it - it shows that costs were rising and it couldn’t pass them onto its customers.
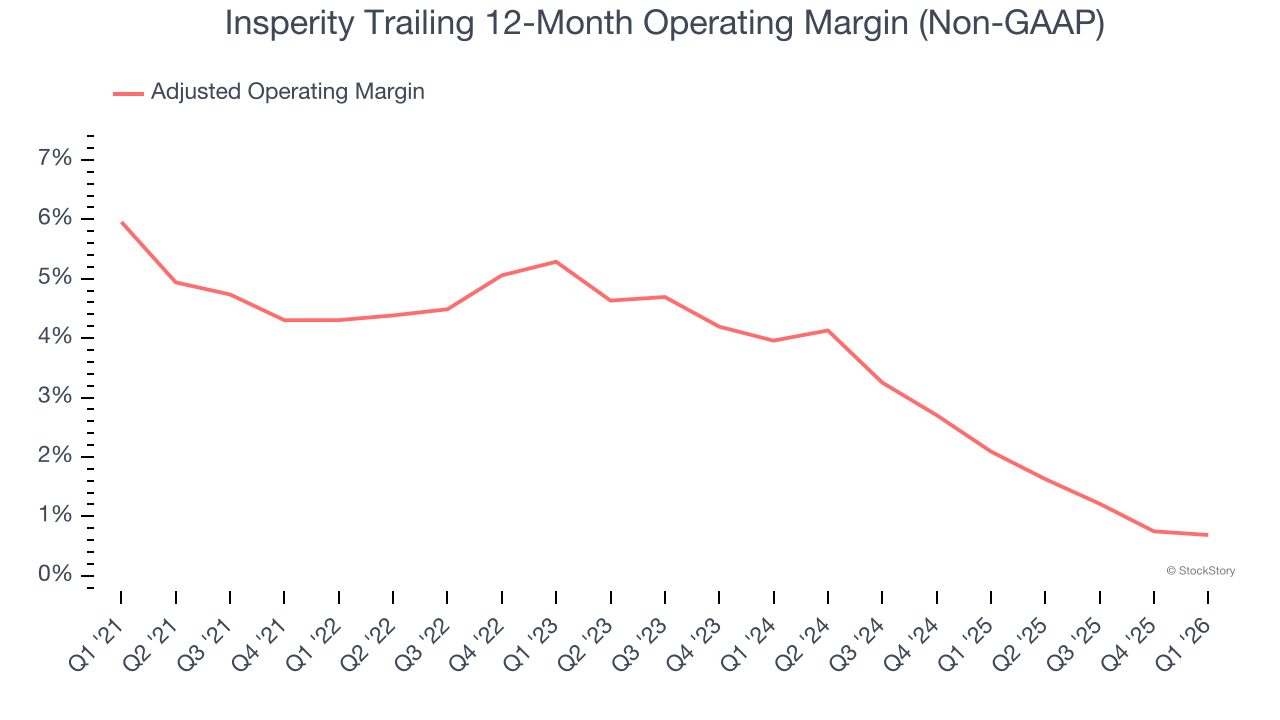
In Q1, Insperity generated an adjusted operating margin profit margin of 4%, in line with the same quarter last year. This indicates the company’s overall cost structure has been relatively stable.
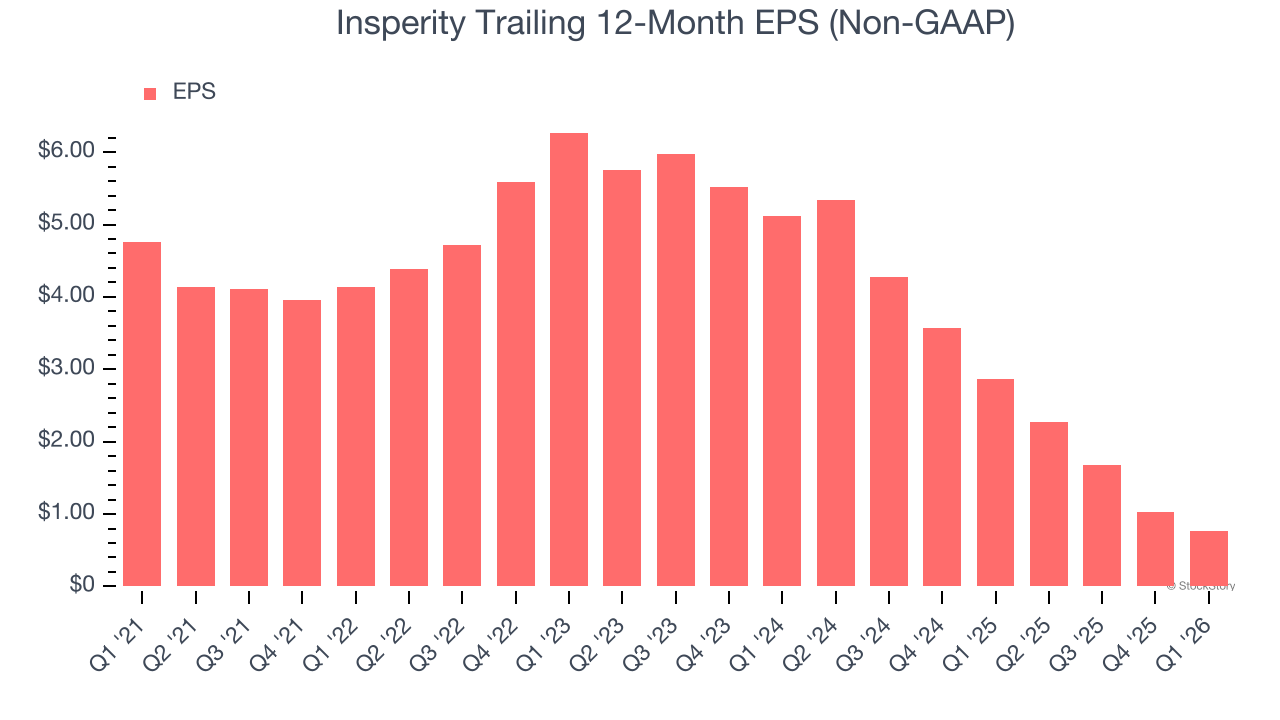
Earnings Per Share
We track the long-term change in earnings per share (EPS) for the same reason as long-term revenue growth. Compared to revenue, however, EPS highlights whether a company’s growth is profitable.
Sadly for Insperity, its EPS declined by 30.5% annually over the last five years while its revenue grew by 9.5%. This tells us the company became less profitable on a per-share basis as it expanded due to non-fundamental factors such as interest expenses and taxes.
We can take a deeper look into Insperity’s earnings to better understand the drivers of its performance. As we mentioned earlier, Insperity’s adjusted operating margin was flat this quarter but declined by 3.6 percentage points over the last five years. This was the most relevant factor (aside from the revenue impact) behind its lower earnings; interest expenses and taxes can also affect EPS but don’t tell us as much about a company’s fundamentals.
Like with revenue, we analyze EPS over a more recent period because it can provide insight into an emerging theme or development for the business.
For Insperity, its two-year annual EPS declines of 61.2% show it’s continued to underperform. These results were bad no matter how you slice the data.
In Q1, Insperity reported adjusted EPS of $1.31, down from $1.57 in the same quarter last year. Despite falling year on year, this print beat analysts’ estimates by 6.2%. We also like to analyze expected EPS growth based on Wall Street analysts’ consensus projections, but there is insufficient data.
Key Takeaways from Insperity’s Q1 Results
It was good to see Insperity beat analysts’ EPS expectations this quarter. On the other hand, its EPS guidance for next quarter missed and its full-year EPS guidance fell short of Wall Street’s estimates. Overall, this was a softer quarter. The stock traded down 1.9% to $34.91 immediately after reporting.
Insperity’s latest earnings report disappointed. One quarter doesn’t define a company’s quality, so let’s explore whether the stock is a buy at the current price. We think that the latest quarter is only one piece of the longer-term business quality puzzle. Quality, when combined with valuation, can help determine if the stock is a buy. We cover that in our actionable full research report which you can read here (it’s free).