Premium cinema technology company IMAX (NYSE: IMAX) met Wall Street’s revenue expectations in Q1 CY2026, but sales fell by 6.1% year on year to $81.38 million. Its non-GAAP profit of $0.17 per share was 10.7% above analysts’ consensus estimates.
Is now the time to buy IMAX? Find out by accessing our full research report, it’s free.
IMAX (IMAX) Q1 CY2026 Highlights:
- Revenue: $81.38 million vs analyst estimates of $81.01 million (6.1% year-on-year decline, in line)
- Adjusted EPS: $0.17 vs analyst estimates of $0.15 (10.7% beat)
- Adjusted EBITDA: $26.81 million vs analyst estimates of $29.22 million (32.9% margin, 8.3% miss)
- Operating Margin: 12.2%, down from 19.3% in the same quarter last year
- Free Cash Flow was $1.90 million, up from -$7.67 million in the same quarter last year
- Market Capitalization: $2.01 billion
Company Overview
Originally developed for World Expo '67 in Montreal as an innovative projection system, IMAX (NYSE: IMAX) provides proprietary large-format cinema technology and systems that deliver immersive movie experiences with enhanced image quality and sound.
Revenue Growth
A company’s long-term sales performance is one signal of its overall quality. Any business can put up a good quarter or two, but the best consistently grow over the long haul.
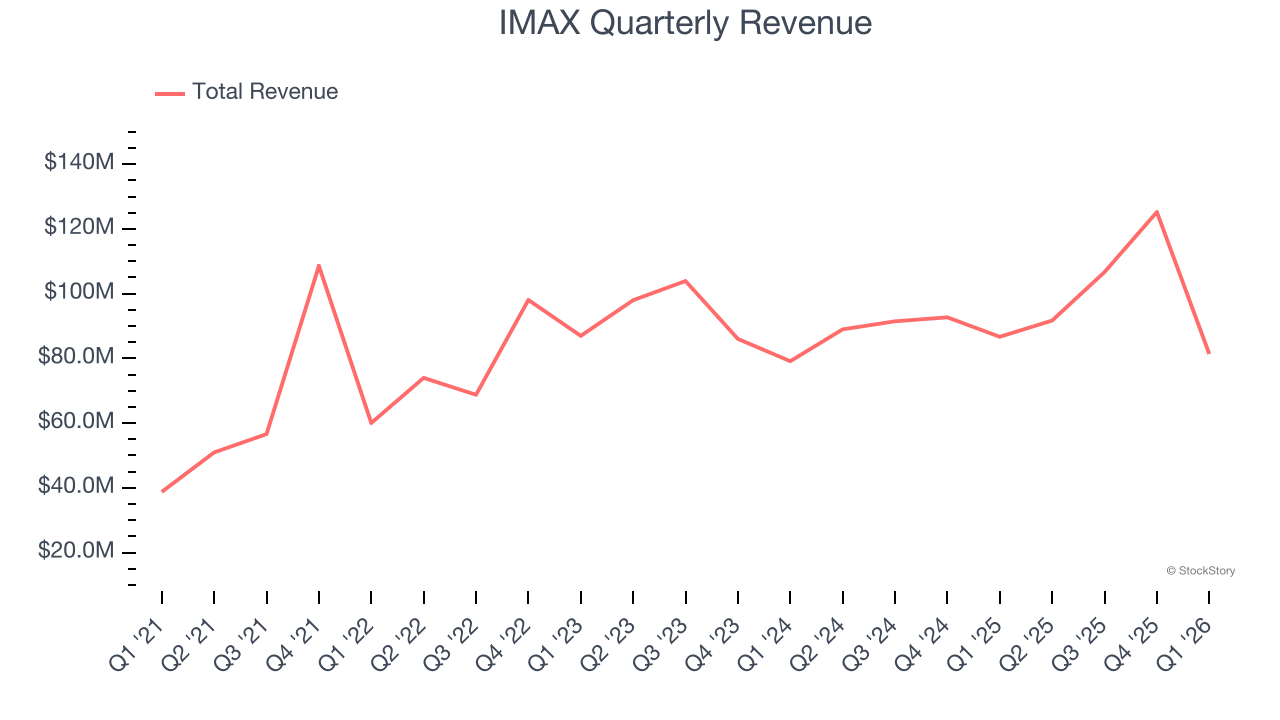
With $404.9 million in revenue over the past 12 months, IMAX is a small player in the business services space, which sometimes brings disadvantages compared to larger competitors benefiting from economies of scale and numerous distribution channels. On the bright side, it can grow faster because it has more room to expand.
As you can see below, IMAX’s sales grew at an incredible 23.5% compounded annual growth rate over the last five years. This is a great starting point for our analysis because it shows IMAX’s demand was higher than many business services companies.
Long-term growth is the most important, but within business services, a half-decade historical view may miss new innovations or demand cycles. IMAX’s annualized revenue growth of 5% over the last two years is below its five-year trend, but we still think the results were respectable. 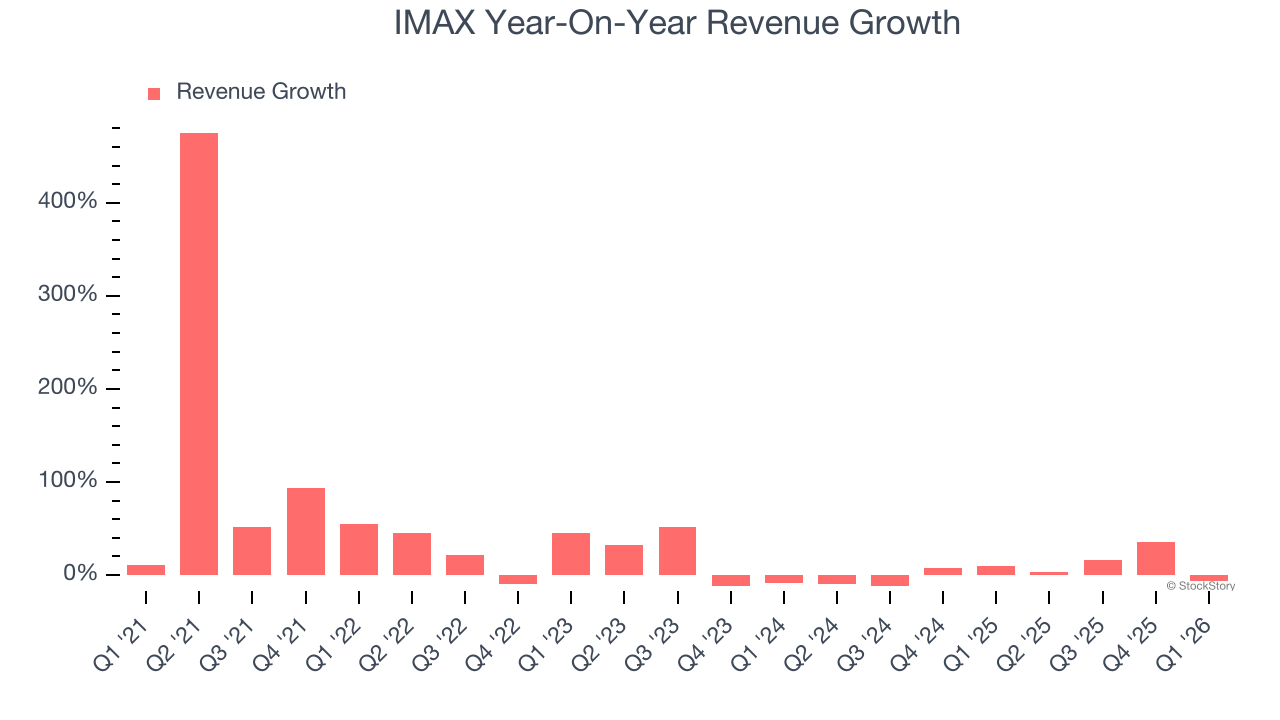
This quarter, IMAX reported a rather uninspiring 6.1% year-on-year revenue decline to $81.38 million of revenue, in line with Wall Street’s estimates.
Looking ahead, sell-side analysts expect revenue to grow 10.8% over the next 12 months, an improvement versus the last two years. This projection is noteworthy and implies its newer products and services will fuel better top-line performance.
ALSO WORTH WATCHING: Nvidia’s Quiet Partner. Nvidia’s chips cost a hundred grand. The connectors that make them work cost even more. One company makes them all.
Every AI server needs specialized infrastructure the chip companies don’t make. High-speed cables. Power connectors. Thermal sensors. This 90-year-old company built a monopoly on it. The AI boom just started. This stock is still flying under the radar. Claim The Stock Ticker Here for FREE.
Adjusted Operating Margin
Adjusted operating margin is one of the best measures of profitability because it tells us how much money a company takes home after subtracting all core expenses, like marketing and R&D. It also removes various one-time costs to paint a better picture of normalized profits.
IMAX has managed its cost base well over the last five years. It demonstrated solid profitability for a business services business, producing an average adjusted operating margin of 12.2%.
Looking at the trend in its profitability, IMAX’s adjusted operating margin rose by 15.6 percentage points over the last five years, as its sales growth gave it immense operating leverage.
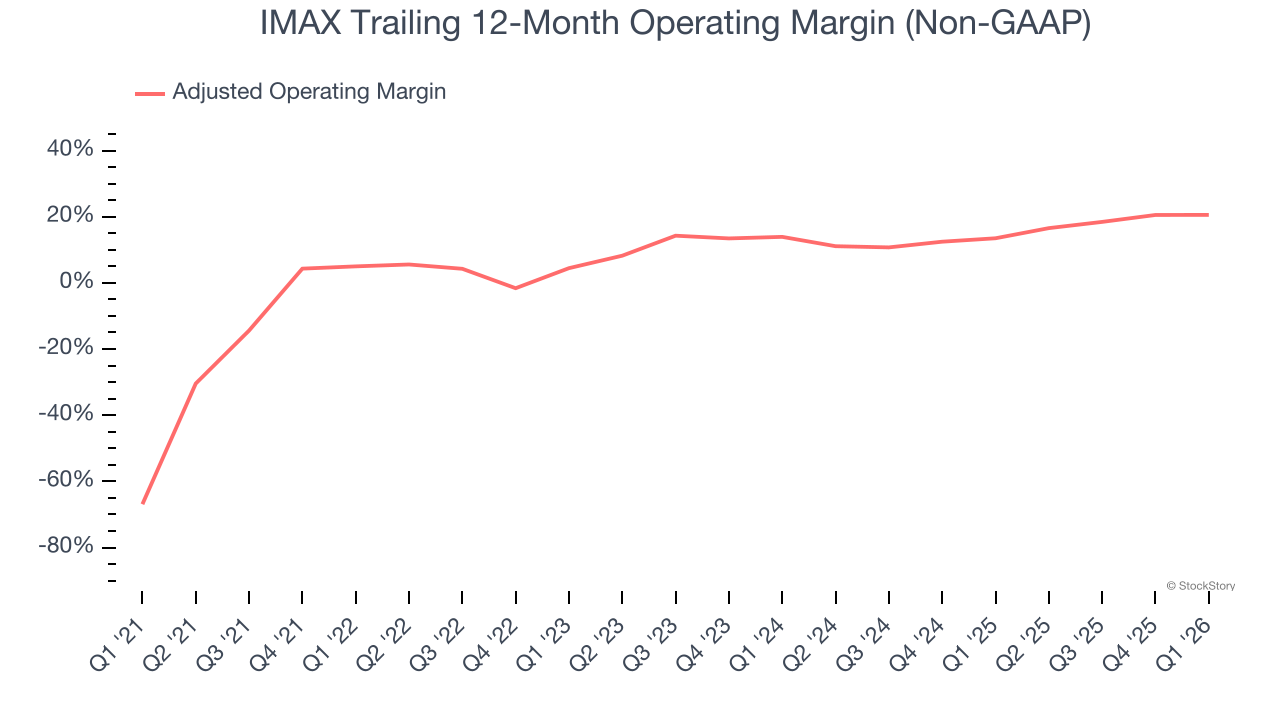
In Q1, IMAX generated an adjusted operating margin profit margin of 19.3%, in line with the same quarter last year. This indicates the company’s overall cost structure has been relatively stable.
Earnings Per Share
We track the long-term change in earnings per share (EPS) for the same reason as long-term revenue growth. Compared to revenue, however, EPS highlights whether a company’s growth is profitable.
IMAX’s full-year EPS flipped from negative to positive over the last five years. This is a good sign and shows it’s at an inflection point.
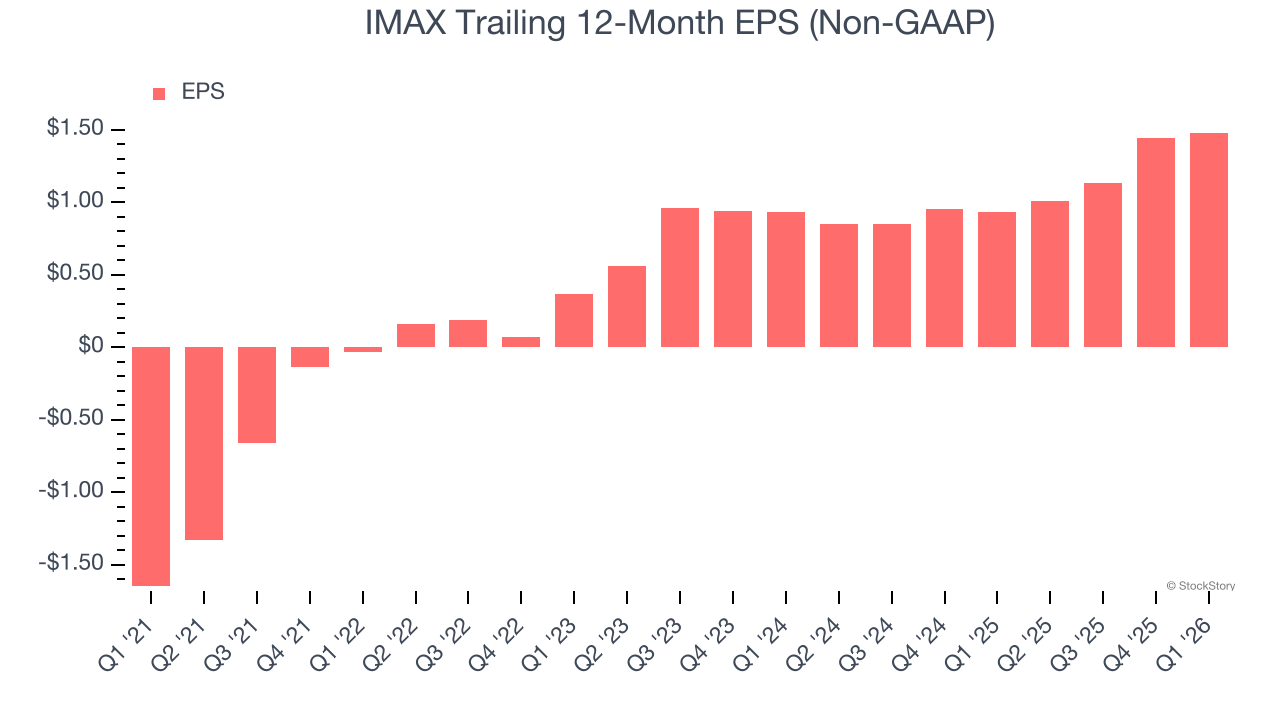
Like with revenue, we analyze EPS over a more recent period because it can provide insight into an emerging theme or development for the business.
IMAX’s EPS grew at an astounding 26.2% compounded annual growth rate over the last two years, higher than its 5% annualized revenue growth. This tells us the company became more profitable on a per-share basis as it expanded.
We can take a deeper look into IMAX’s earnings to better understand the drivers of its performance. While we mentioned earlier that IMAX’s adjusted operating margin was flat this quarter, a two-year view shows its margin has expanded. This was the most relevant factor (aside from the revenue impact) behind its higher earnings; interest expenses and taxes can also affect EPS but don’t tell us as much about a company’s fundamentals.
In Q1, IMAX reported adjusted EPS of $0.17, up from $0.13 in the same quarter last year. This print easily cleared analysts’ estimates, and shareholders should be content with the results. Over the next 12 months, Wall Street expects IMAX’s full-year EPS of $1.48 to grow 18.2%.
Key Takeaways from IMAX’s Q1 Results
It was good to see IMAX beat analysts’ EPS expectations this quarter. Overall, we think this was a decent quarter with some key metrics above expectations. The stock remained flat at $37.68 immediately after reporting.
Should you buy the stock or not? We think that the latest quarter is only one piece of the longer-term business quality puzzle. Quality, when combined with valuation, can help determine if the stock is a buy. We cover that in our actionable full research report which you can read here (it’s free).


