
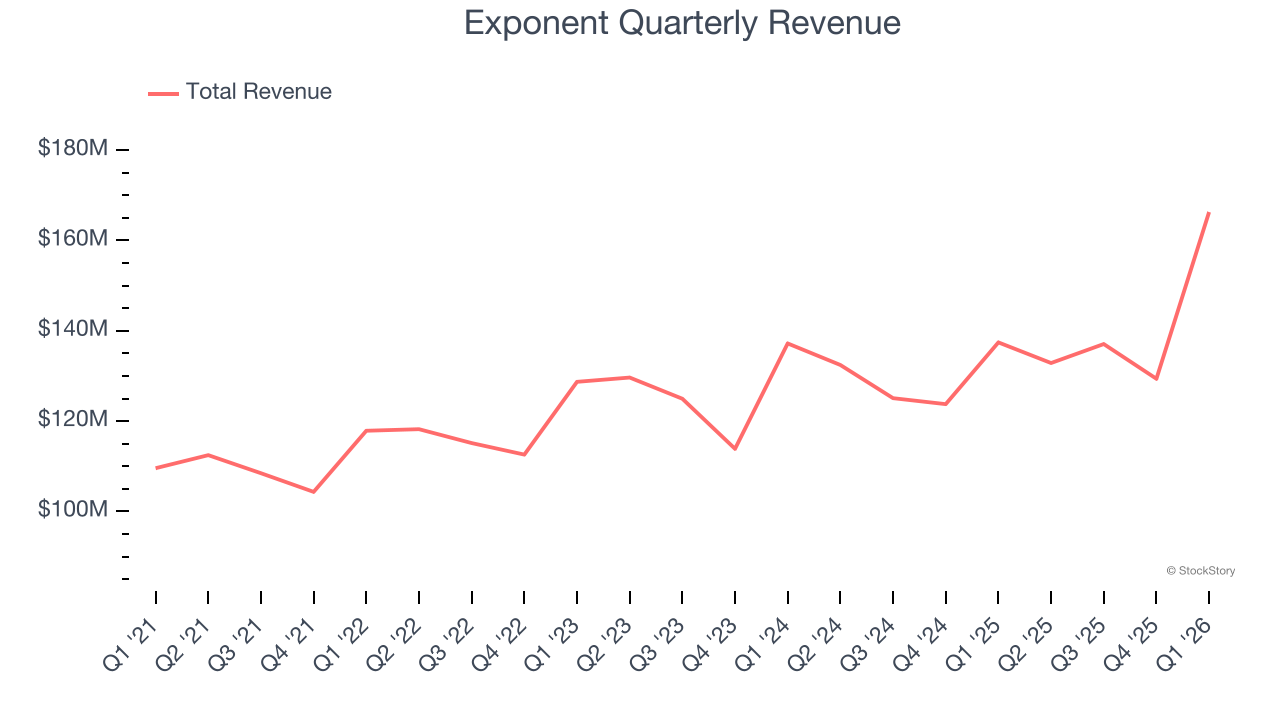
Scientific consulting firm Exponent (NASDAQ: EXPO) announced better-than-expected revenue in Q1 CY2026, with sales up 21% year on year to $166.3 million. Its GAAP profit of $0.59 per share was 4% above analysts’ consensus estimates.
Is now the time to buy Exponent? Find out by accessing our full research report, it’s free.
Exponent (EXPO) Q1 CY2026 Highlights:
- Revenue: $166.3 million vs analyst estimates of $149.2 million (21% year-on-year growth, 11.5% beat)
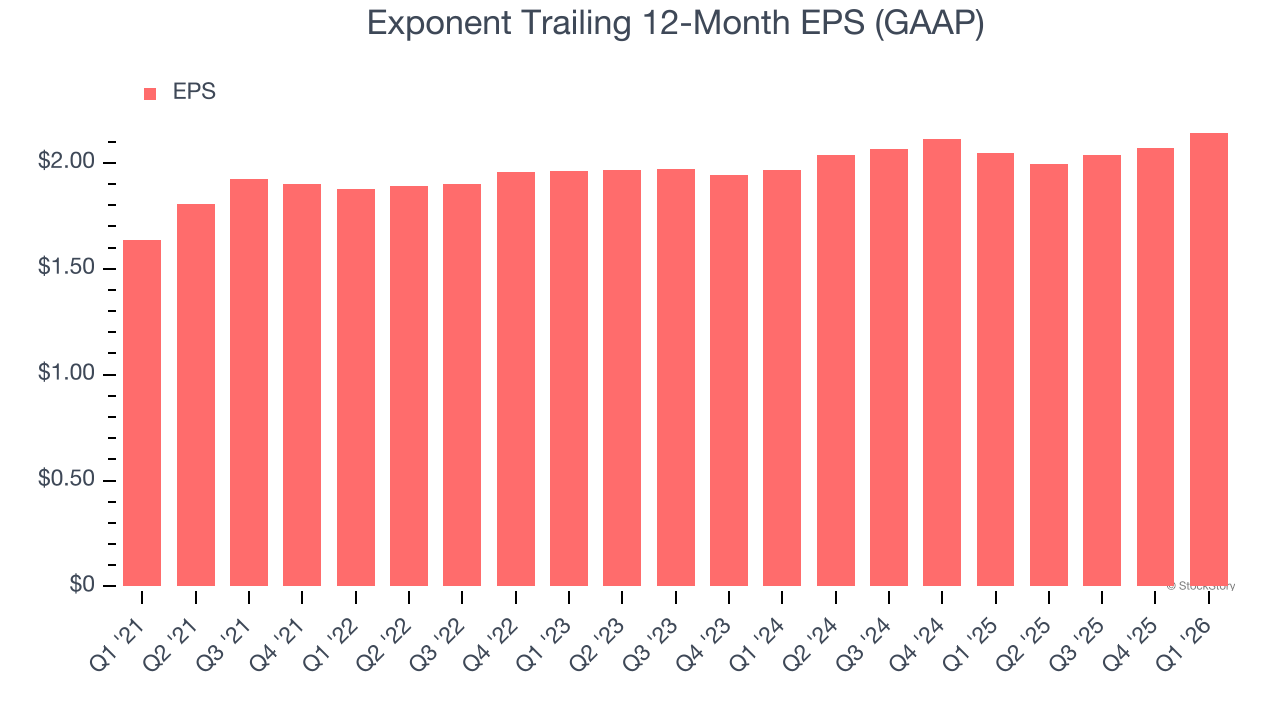
- EPS (GAAP): $0.59 vs analyst estimates of $0.57 (4% beat)
- Adjusted EBITDA: $52.19 million vs analyst estimates of $44.87 million (31.4% margin, 16.3% beat)
- Operating Margin: 24.9%, down from 32.3% in the same quarter last year
- Market Capitalization: $3.26 billion
“Exponent delivered double-digit growth in revenues and earnings during the first quarter, reflecting the strength of our multidisciplinary portfolio and increased demand for our specialized expertise across industries,” stated Dr. Catherine Corrigan, President and Chief Executive Officer.
Company Overview
With a team of over 800 consultants holding advanced degrees in 90+ technical disciplines, Exponent (NASDAQ: EXPO) is a science and engineering consulting firm that investigates complex problems and provides expert analysis for clients across various industries.
Revenue Growth
Examining a company’s long-term performance can provide clues about its quality. Any business can put up a good quarter or two, but many enduring ones grow for years.
With $565.6 million in revenue over the past 12 months, Exponent is a small player in the business services space, which sometimes brings disadvantages compared to larger competitors benefiting from economies of scale and numerous distribution channels. On the bright side, it can grow faster because it has more room to expand.
As you can see below, Exponent’s sales grew at a solid 7.8% compounded annual growth rate over the last five years. This shows it had high demand, a useful starting point for our analysis.
Long-term growth is the most important, but within business services, a half-decade historical view may miss new innovations or demand cycles. Exponent’s annualized revenue growth of 5.8% over the last two years is below its five-year trend, but we still think the results were respectable. 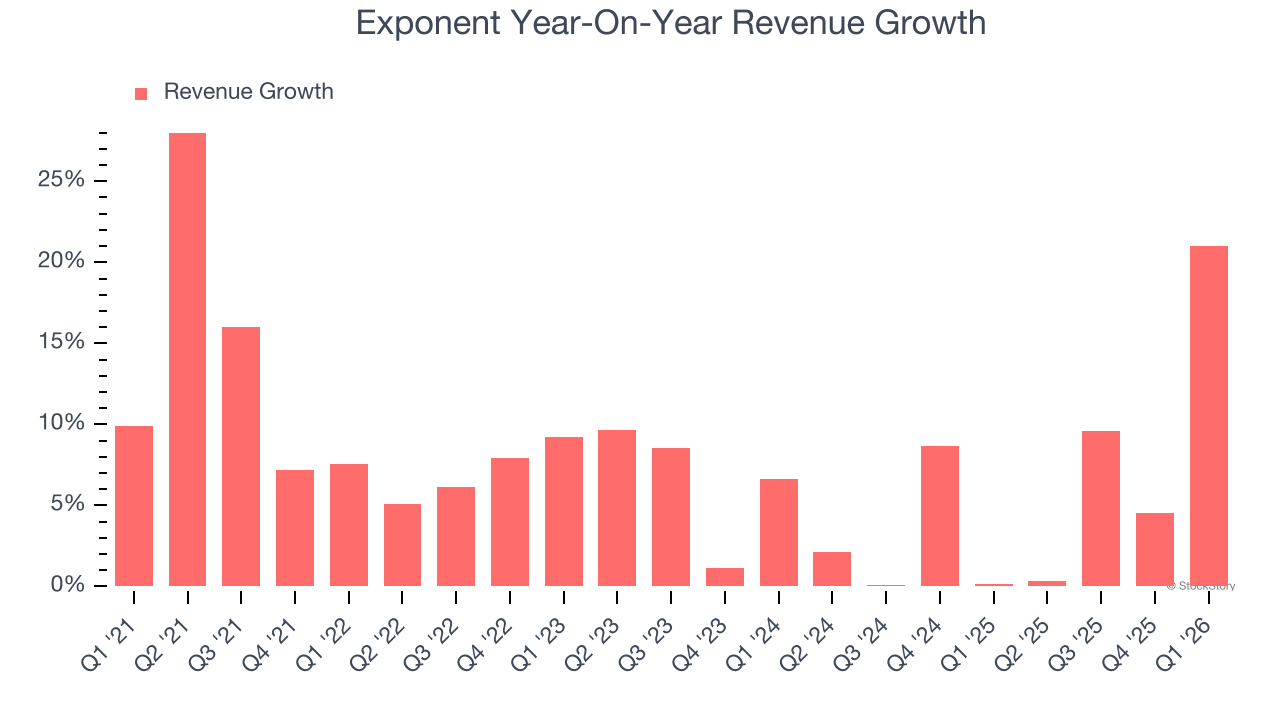
This quarter, Exponent reported robust year-on-year revenue growth of 21%, and its $166.3 million of revenue topped Wall Street estimates by 11.5%.
Looking ahead, sell-side analysts expect revenue to grow 4.5% over the next 12 months, similar to its two-year rate. This projection is underwhelming and indicates its products and services will see some demand headwinds.
ALSO WORTH WATCHING: Nvidia’s Quiet Partner. Nvidia’s chips cost a hundred grand. The connectors that make them work cost even more. One company makes them all.
Every AI server needs specialized infrastructure the chip companies don’t make. High-speed cables. Power connectors. Thermal sensors. This 90-year-old company built a monopoly on it. The AI boom just started. This stock is still flying under the radar. Claim The Stock Ticker Here for FREE.
Adjusted Operating Margin
Adjusted operating margin is a key measure of profitability. Think of it as net income (the bottom line) excluding the impact of non-recurring expenses, taxes, and interest on debt - metrics less connected to business fundamentals.
Exponent has been a well-oiled machine over the last five years. It demonstrated elite profitability for a business services business, boasting an average adjusted operating margin of 29%.
Looking at the trend in its profitability, Exponent’s adjusted operating margin decreased by 6.9 percentage points over the last five years. This raises questions about the company’s expense base because its revenue growth should have given it leverage on its fixed costs, resulting in better economies of scale and profitability.
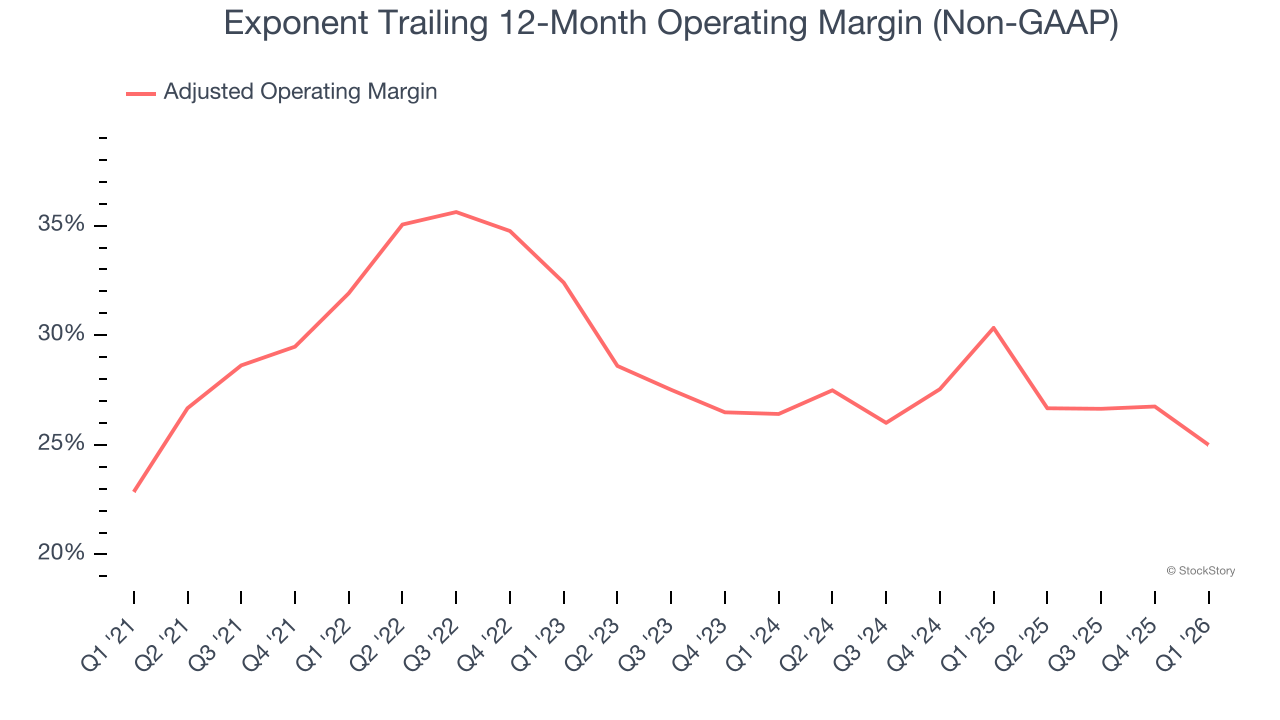
In Q1, Exponent generated an adjusted operating margin profit margin of 30.3%, down 8 percentage points year on year. This contraction shows it was less efficient because its expenses grew faster than its revenue.
Earnings Per Share
We track the long-term change in earnings per share (EPS) for the same reason as long-term revenue growth. Compared to revenue, however, EPS highlights whether a company’s growth is profitable.
Exponent’s EPS grew at an unimpressive 5.5% compounded annual growth rate over the last five years, lower than its 7.8% annualized revenue growth. We can see the difference stemmed from higher interest expenses or taxes as the company actually improved its adjusted operating margin and repurchased its shares during this time.
Diving into the nuances of Exponent’s earnings can give us a better understanding of its performance. As we mentioned earlier, Exponent’s adjusted operating margin declined by 6.9 percentage points over the last five years. This was the most relevant factor (aside from the revenue impact) behind its lower earnings; interest expenses and taxes can also affect EPS but don’t tell us as much about a company’s fundamentals.
Like with revenue, we analyze EPS over a more recent period because it can provide insight into an emerging theme or development for the business.
For Exponent, its two-year annual EPS growth of 4.4% was lower than its five-year trend. We hope its growth can accelerate in the future.
In Q1, Exponent reported EPS of $0.59, up from $0.52 in the same quarter last year. This print beat analysts’ estimates by 4%. We also like to analyze expected EPS growth based on Wall Street analysts’ consensus projections, but there is insufficient data.
Key Takeaways from Exponent’s Q1 Results
We were impressed by how significantly Exponent blew past analysts’ revenue expectations this quarter. We were also glad its EPS outperformed Wall Street’s estimates. Zooming out, we think this quarter featured some important positives. The stock remained flat at $67.22 immediately after reporting.
Exponent had an encouraging quarter, but one earnings result doesn’t necessarily make the stock a buy. Let’s see if this is a good investment. If you’re making that decision, you should consider the bigger picture of valuation, business qualities, as well as the latest earnings. We cover that in our actionable full research report which you can read here (it’s free).