
Climate control solutions innovator Lennox International (NYSE: LII) reported Q1 CY2026 results exceeding the market’s revenue expectations, with sales up 5.8% year on year to $1.14 billion. Its GAAP profit of $3.35 per share was 6.7% above analysts’ consensus estimates.
Is now the time to buy Lennox? Find out by accessing our full research report, it’s free.
Lennox (LII) Q1 CY2026 Highlights:
- Revenue: $1.14 billion vs analyst estimates of $1.06 billion (5.8% year-on-year growth, 6.7% beat)
- EPS (GAAP): $3.35 vs analyst estimates of $3.14 (6.7% beat)
- Adjusted EBITDA: $199 million vs analyst estimates of $187.9 million (17.5% margin, 5.9% beat)
- EPS (GAAP) guidance for the full year is $24.25 at the midpoint, roughly in line with what analysts were expecting
- Operating Margin: 14.4%, down from 15.7% in the same quarter last year
- Free Cash Flow was -$39.4 million compared to -$61.3 million in the same quarter last year
- Organic Revenue rose 6% year on year (beat)
- Market Capitalization: $17.25 billion
"Our results this quarter were supported by stabilizing end-markets and encouraging momentum across our strategic initiatives, including the integration of Duro Dyne and Supco. We remain confident in our strategy to deliver long-term shareholder value through differentiated growth and bolt-on M&A opportunities," said CEO, Alok Maskara.
Company Overview
Based in Texas and founded over a century ago, Lennox (NYSE: LII) is a climate control solutions company offering heating, ventilation, air conditioning, and refrigeration (HVACR) goods.
Revenue Growth
A company’s long-term sales performance can indicate its overall quality. Any business can put up a good quarter or two, but the best consistently grow over the long haul. Over the last five years, Lennox grew its sales at a decent 9% compounded annual growth rate. Its growth was slightly above the average industrials company and shows its offerings resonate with customers.
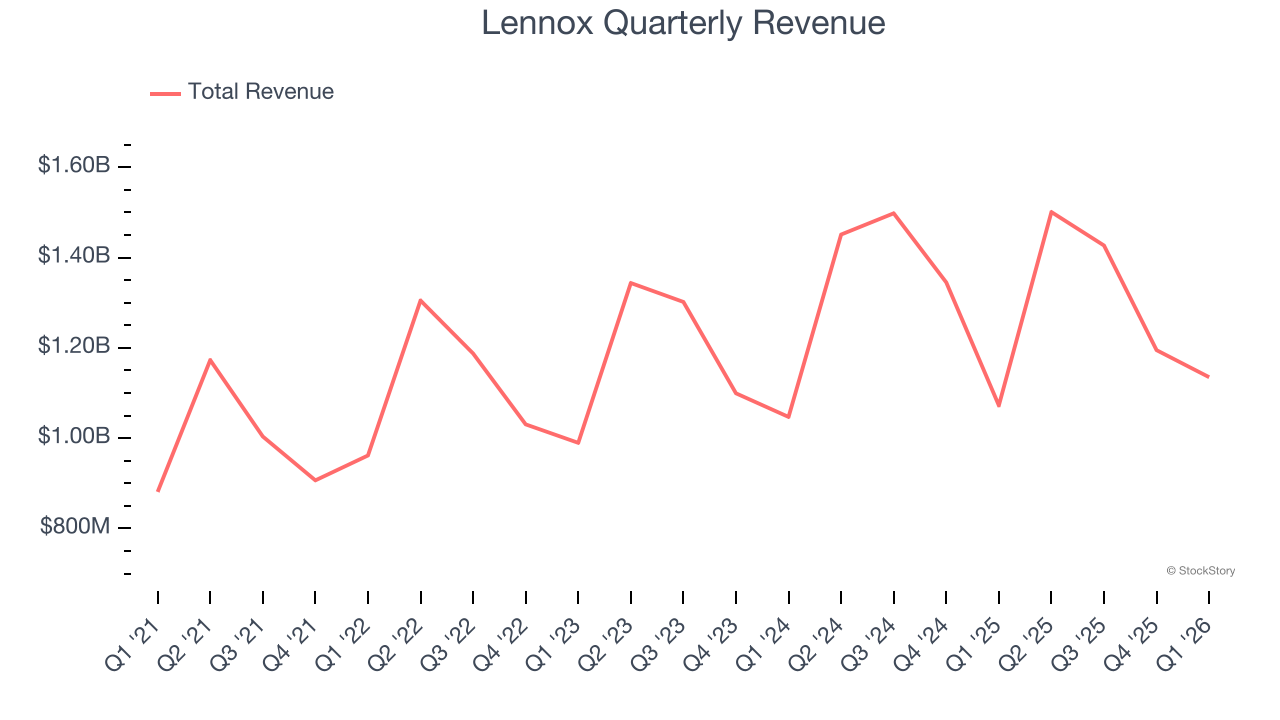
We at StockStory place the most emphasis on long-term growth, but within industrials, a half-decade historical view may miss cycles, industry trends, or a company capitalizing on catalysts such as a new contract win or a successful product line. Lennox’s recent performance shows its demand has slowed as its annualized revenue growth of 4.7% over the last two years was below its five-year trend. We’re wary when companies in the sector see decelerations in revenue growth, as it could signal changing consumer tastes aided by low switching costs. 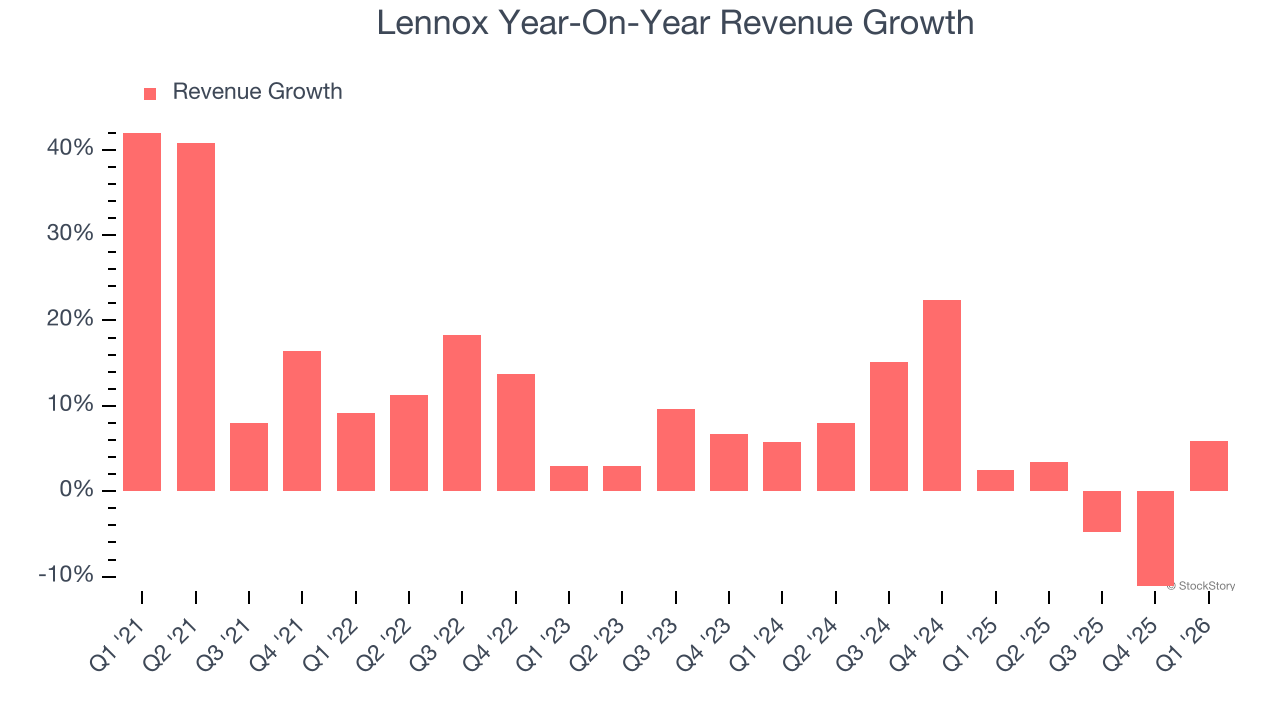
We can better understand the company’s sales dynamics by analyzing its organic revenue, which strips out one-time events like acquisitions and currency fluctuations that don’t accurately reflect its fundamentals. Over the last two years, Lennox’s organic revenue averaged 5% year-on-year growth. Because this number aligns with its two-year revenue growth, we can see the company’s core operations (not acquisitions and divestitures) drove most of its results. 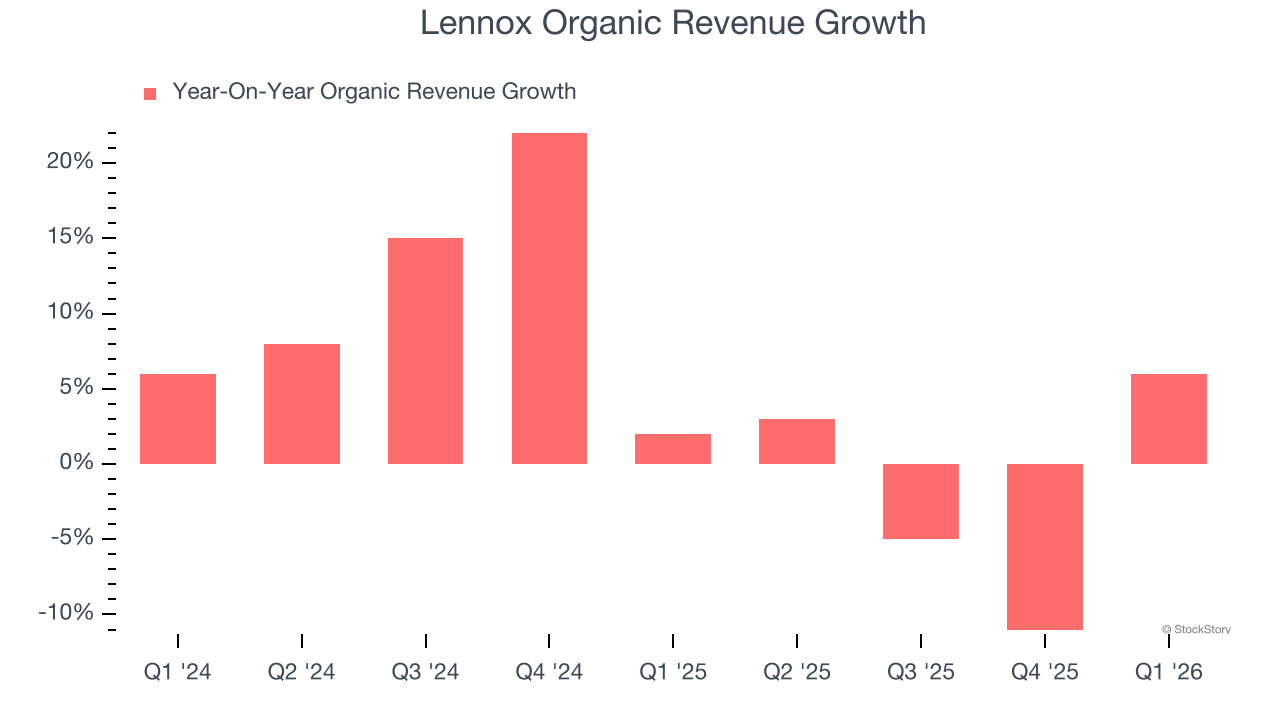
This quarter, Lennox reported year-on-year revenue growth of 5.8%, and its $1.14 billion of revenue exceeded Wall Street’s estimates by 6.7%.
Looking ahead, sell-side analysts expect revenue to grow 5.6% over the next 12 months, similar to its two-year rate. This projection doesn't excite us and implies its newer products and services will not accelerate its top-line performance yet. At least the company is tracking well in other measures of financial health.
WHILE YOU’RE HERE: The Next Palantir? One satellite company captures images of every point on Earth. Every single day. The Pentagon wants it. Hedge funds are using it to beat earnings. You’ve probably never heard of it.
This is what the early days of Palantir looked like before it became a $437 billion giant. Same playbook. Different technology. If you missed Palantir, you need to see this. Claim The Stock Ticker for Free HERE.
Operating Margin
Operating margin is a key measure of profitability. Think of it as net income - the bottom line - excluding the impact of taxes and interest on debt, which are less connected to business fundamentals.
Lennox has been a well-oiled machine over the last five years. It demonstrated elite profitability for an industrials business, boasting an average operating margin of 17.4%. This result was particularly impressive because of its low gross margin, which is mostly a factor of what it sells and takes huge shifts to move meaningfully. Companies have more control over their operating margins, and it’s a show of well-managed operations if they’re high when gross margins are low.
Looking at the trend in its profitability, Lennox’s operating margin rose by 5.2 percentage points over the last five years, as its sales growth gave it immense operating leverage.
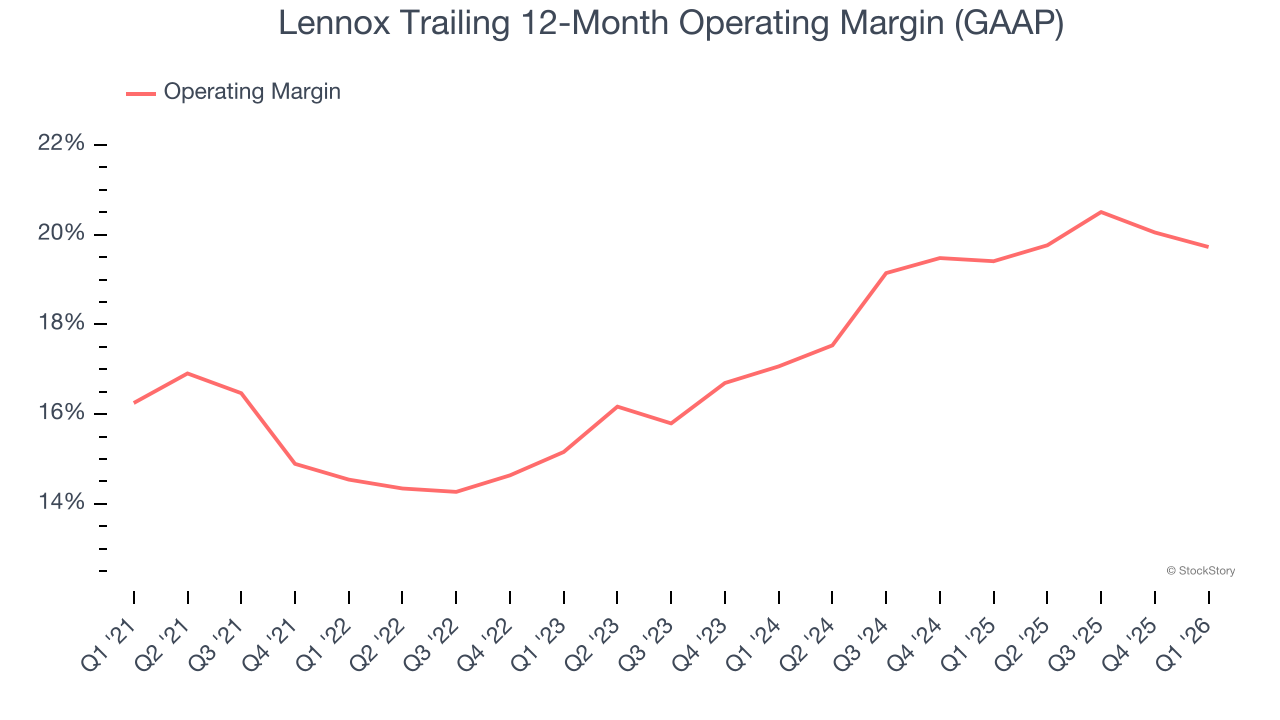
This quarter, Lennox generated an operating margin profit margin of 14.4%, down 1.3 percentage points year on year. Since Lennox’s operating margin decreased more than its gross margin, we can assume it was less efficient because expenses such as marketing, R&D, and administrative overhead increased.
Earnings Per Share
Revenue trends explain a company’s historical growth, but the long-term change in earnings per share (EPS) points to the profitability of that growth – for example, a company could inflate its sales through excessive spending on advertising and promotions.
Lennox’s EPS grew at 15.2% compounded annual growth rate over the last five years, higher than its 9% annualized revenue growth. This tells us the company became more profitable on a per-share basis as it expanded.
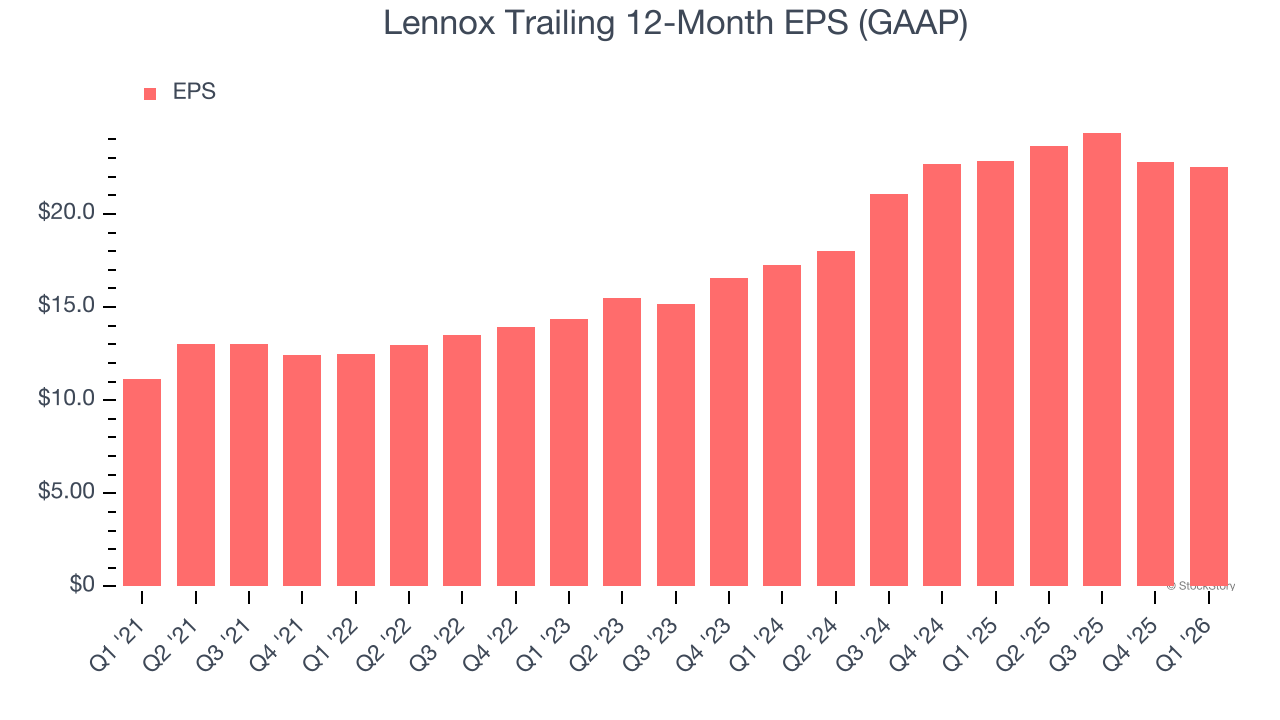
We can take a deeper look into Lennox’s earnings to better understand the drivers of its performance. As we mentioned earlier, Lennox’s operating margin declined this quarter but expanded by 5.2 percentage points over the last five years. Its share count also shrank by 8.4%, and these factors together are positive signs for shareholders because improving profitability and share buybacks turbocharge EPS growth relative to revenue growth. 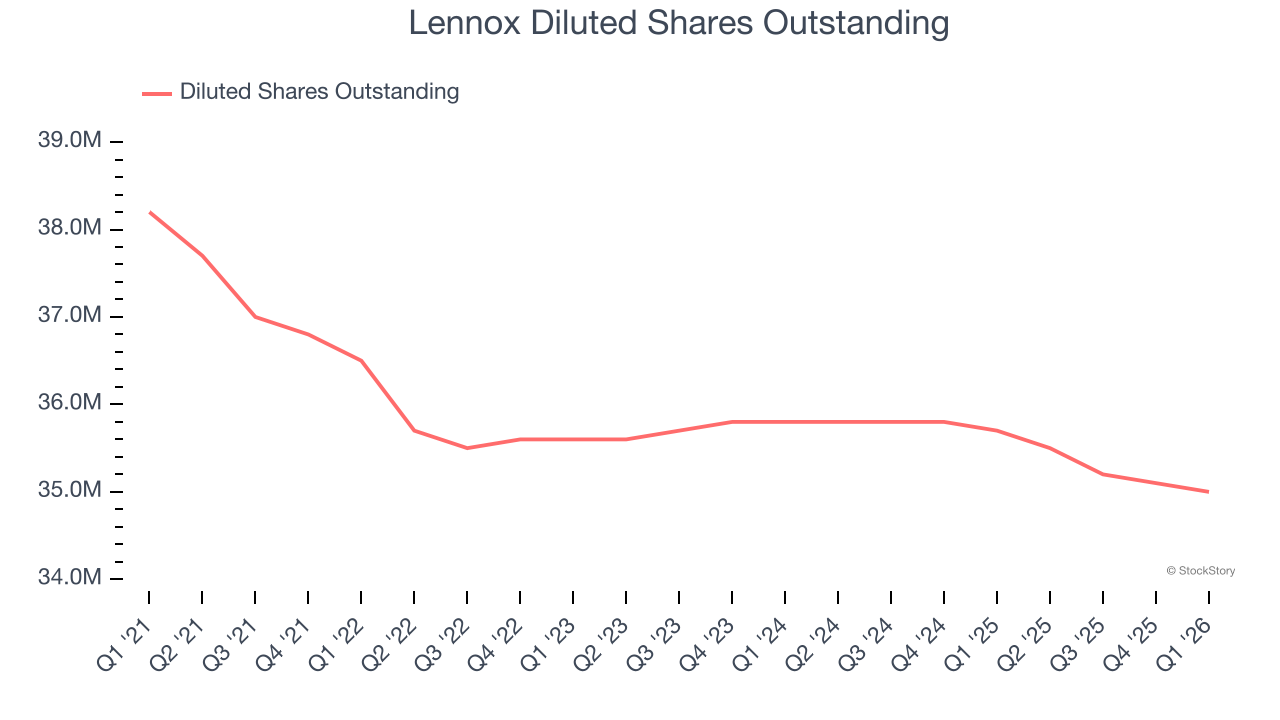
Like with revenue, we analyze EPS over a shorter period to see if we are missing a change in the business.
For Lennox, its two-year annual EPS growth of 14.2% is similar to its five-year trend, implying strong and stable earnings power.
In Q1, Lennox reported EPS of $3.35, down from $3.63 in the same quarter last year. Despite falling year on year, this print beat analysts’ estimates by 6.7%. Over the next 12 months, Wall Street expects Lennox’s full-year EPS of $22.50 to grow 8.8%.
Key Takeaways from Lennox’s Q1 Results
We were impressed by how significantly Lennox blew past analysts’ organic revenue expectations this quarter. We were also excited its adjusted operating income outperformed Wall Street’s estimates by a wide margin. Zooming out, we think this was a good print with some key areas of upside. The stock remained flat at $495.48 immediately after reporting.
Should you buy the stock or not? We think that the latest quarter is only one piece of the longer-term business quality puzzle. Quality, when combined with valuation, can help determine if the stock is a buy. We cover that in our actionable full research report which you can read here (it’s free).