
Online new and used car marketplace Cars.com (NYSE: CARS) met Wall Street’s revenue expectations in Q4 CY2025, with sales up 1.9% year on year to $183.9 million. Its non-GAAP profit of $0.44 per share was 19.7% below analysts’ consensus estimates.
Is now the time to buy Cars.com? Find out by accessing our full research report, it’s free.
Cars.com (CARS) Q4 CY2025 Highlights:
- Revenue: $183.9 million vs analyst estimates of $183.6 million (1.9% year-on-year growth, in line)
- Adjusted EPS: $0.44 vs analyst expectations of $0.55 (19.7% miss)
- Adjusted EBITDA: $54.9 million vs analyst estimates of $58.59 million (29.9% margin, 6.3% miss)
- Operating Margin: 11.8%, in line with the same quarter last year
- Free Cash Flow Margin: 17%, down from 29% in the previous quarter
- Dealer Customers: 19,544, up 338 year on year
- Market Capitalization: $642.4 million
Company Overview
Originally started as a joint venture between several media companies including The Washington Post and The New York Times, Cars.com (NYSE: CARS) is a digital marketplace that connects new and used car buyers and sellers.
Revenue Growth
A company’s long-term sales performance is one signal of its overall quality. Any business can have short-term success, but a top-tier one grows for years. Over the last three years, Cars.com grew its sales at a sluggish 3.4% compounded annual growth rate. This fell short of our benchmark for the consumer internet sector and is a rough starting point for our analysis.
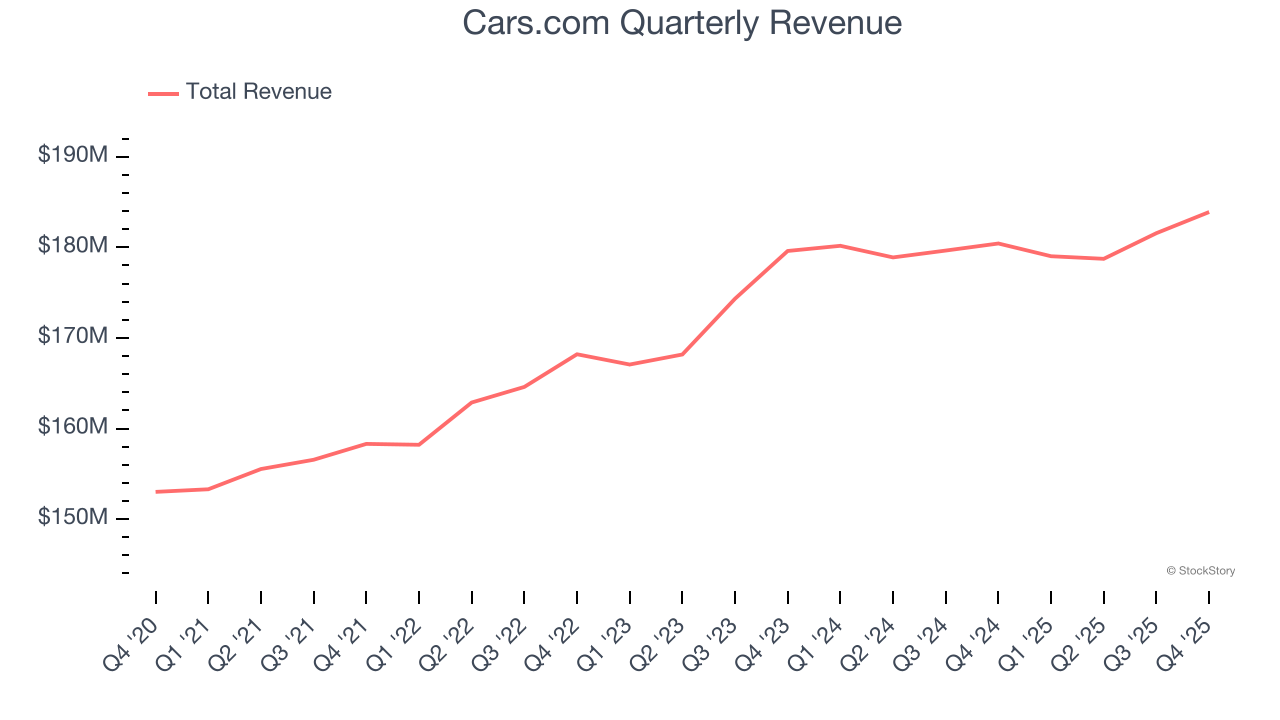
This quarter, Cars.com grew its revenue by 1.9% year on year, and its $183.9 million of revenue was in line with Wall Street’s estimates.
Looking ahead, sell-side analysts expect revenue to grow 2.6% over the next 12 months, similar to its three-year rate. This projection doesn't excite us and implies its newer products and services will not catalyze better top-line performance yet.
The 1999 book Gorilla Game predicted Microsoft and Apple would dominate tech before it happened. Its thesis? Identify the platform winners early. Today, enterprise software companies embedding generative AI are becoming the new gorillas. a profitable, fast-growing enterprise software stock that is already riding the automation wave and looking to catch the generative AI next.
Dealer Customers
Buyer Growth
As an online marketplace, Cars.com generates revenue growth by increasing both the number of users on its platform and the average order size in dollars.
Over the last two years, Cars.com’s dealer customers, a key performance metric for the company, increased by 1% annually to 19,544 in the latest quarter. This growth rate is one of the lowest in the consumer internet sector. If Cars.com wants to accelerate growth, it likely needs to engage users more effectively with its existing offerings or innovate with new products. 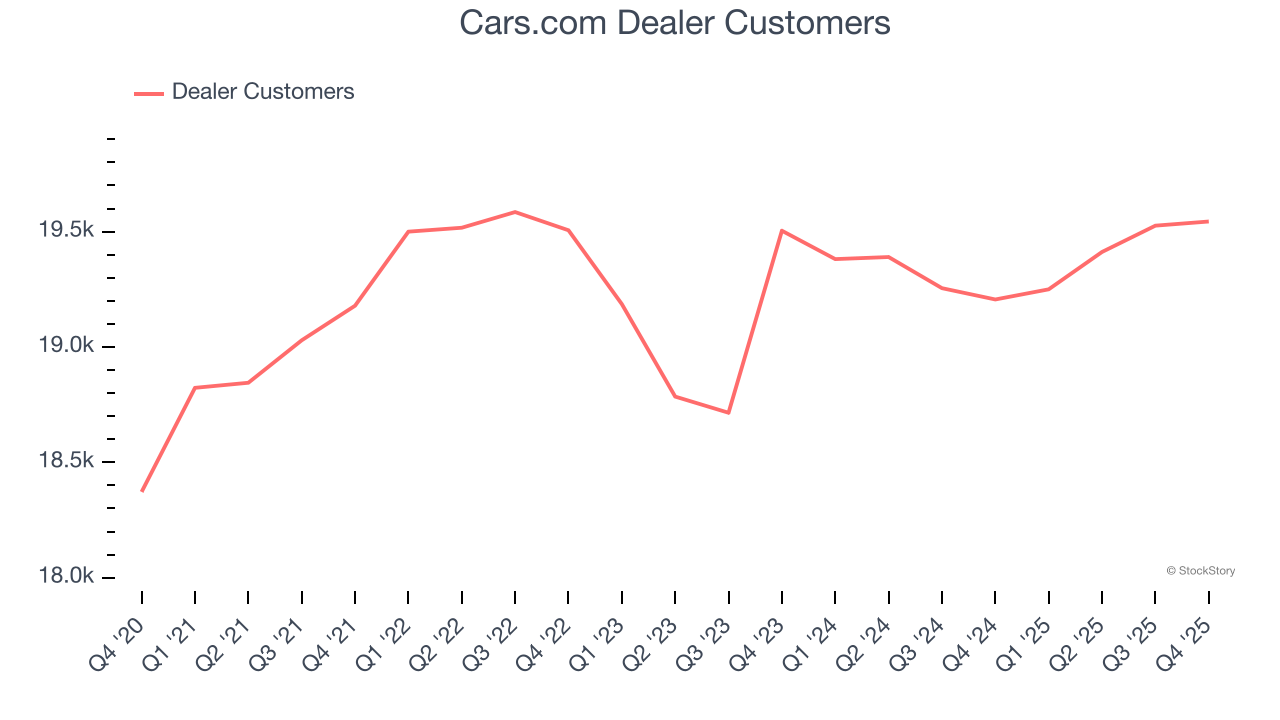
In Q4, Cars.com added 338 dealer customers, leading to 1.8% year-on-year growth. The quarterly print isn’t too different from its two-year result, suggesting its new initiatives aren’t accelerating buyer growth just yet.
Revenue Per Buyer
Average revenue per buyer (ARPB) is a critical metric to track because it measures how much the company earns in transaction fees from each buyer. ARPB also gives us unique insights into a user’s average order size and Cars.com’s take rate, or "cut", on each order.
Cars.com’s ARPB has been roughly flat over the last two years. This isn’t great when combined with its weaker dealer customers performance. If Cars.com tries boosting ARPB by taking a more aggressive approach to monetization, it’s unclear whether buyer growth would be sustainable. 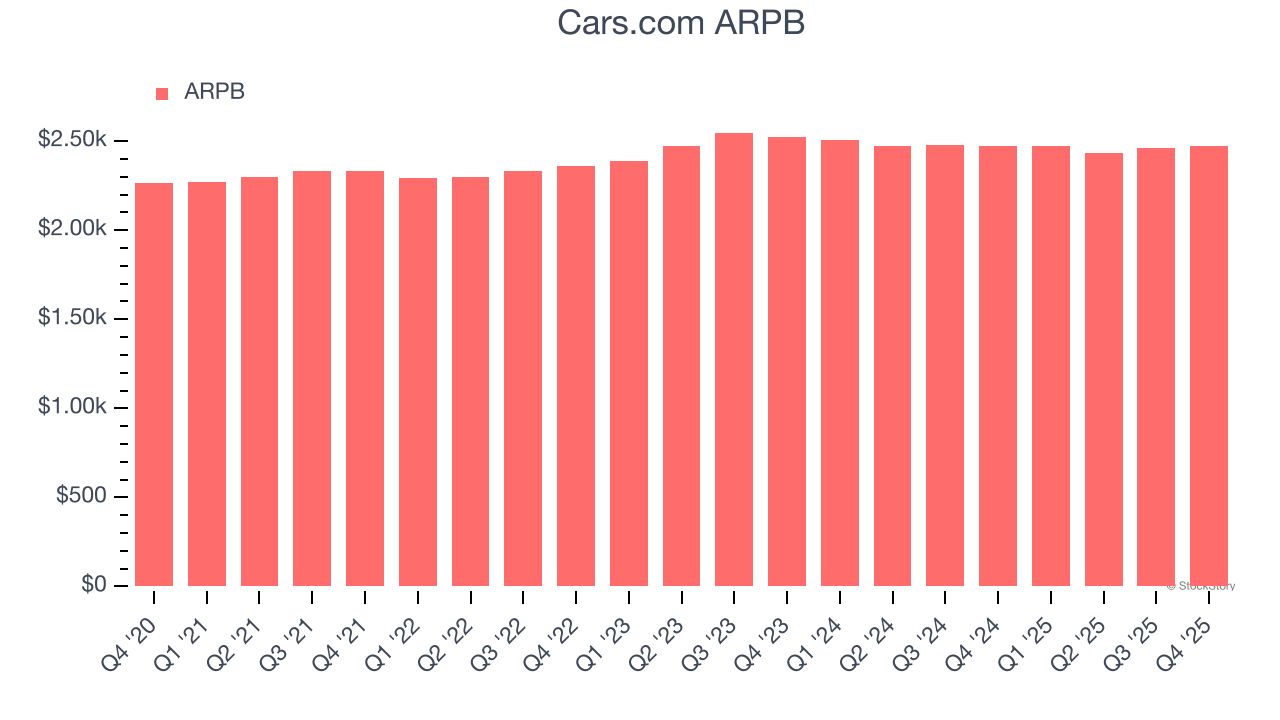
This quarter, Cars.com’s ARPB clocked in at $2,472. It was flat year on year, worse than the change in its dealer customers.
Key Takeaways from Cars.com’s Q4 Results
We struggled to find many positives in these results. Overall, this quarter could have been better. The stock traded down 9.8% to $9.69 immediately after reporting.
Cars.com may have had a tough quarter, but does that actually create an opportunity to invest right now? The latest quarter does matter, but not nearly as much as longer-term fundamentals and valuation, when deciding if the stock is a buy. We cover that in our actionable full research report which you can read here (it’s free).


