Financial services company The Bancorp (NASDAQ: TBBK) missed Wall Street’s revenue expectations in Q3 2026, with revenue flat year on year at $175.9 million. Its GAAP profit of $1.53 per share was 6% above analysts’ consensus estimates.
For more on The Bancorp, read the full research report for free.
The Bancorp (TBBK) Q3 2026 highlights:
- Net interest income $90.07 million vs analysts’ consensus estimates of $90.56 million (4.4% year-on-year decline, 0.5% miss)
- Net interest margin 3.8% vs analysts’ consensus estimates of 3.8% (9.7 basis point miss)
- Revenue $175.9 million vs S&P analysts’ consensus estimates of $178.4 million (flat year on year, 1.4% miss)
- Efficiency ratio 42.2% vs analysts’ consensus estimates of 38% (420 basis point miss)
- EPS (GAAP) $1.53 vs analysts’ consensus estimates of $1.44 (6% beat)
- Tangible book value per share $16.83 vs analysts’ consensus estimates of $17.72 (3.6% year-on-year decline, 5% miss)
- Market capitalization $2.06 billion
“It was a very eventful quarter for The Bancorp,” said Damian Kozlowski, CEO of The Bancorp, Inc. “We continued with strong momentum in Fintech and took actions to support future growth and increasing productivity and efficiency. I remain confident that we are well positioned to maintain our market-leading profitability and competitive position, while we continue to build and enhance our one-of-a-kind fintech ecosystem and franchise. We are maintaining Core EPS(1) guidance in the range of $5.95-$6.05 a share for 2026(2), and providing a Core EPS(1) baseline range of $7.00 - $7.20 a share for 2027. In addition, we are initiating preliminary Core EPS(1) guidance for 2028 of $8.00 - $8.20 a share. Our guidance in 2026, 2027 and 2028 includes stock buybacks. We expect to repurchase $200 million of shares in 2026, or $50 million a quarter. We are currently targeting buyback amounts for 2027 through Q1 2028 to be approximately 100% of Adjusted net income(1). We expect our three major Fintech initiatives along with platform efficiency and productivity gains from our organizational restructuring and adoption of AI tools, plus capital return through continued buybacks, will be the driving forces behind EPS accretion. EPS gains are subject to development and implementation timelines in Fintech, and our stock price for buybacks.”
Revenue growth
From lending activities to service fees, most banks build their revenue model around two income sources. Interest rate spreads between loans and deposits create the first stream, with the second coming from charges on everything from basic bank accounts to complex investment banking transactions. The Bancorp’s revenue grew at a strong 16.6% compounded annual growth rate over the last five years. Its growth beat the average banking company and shows its offerings resonate with customers.
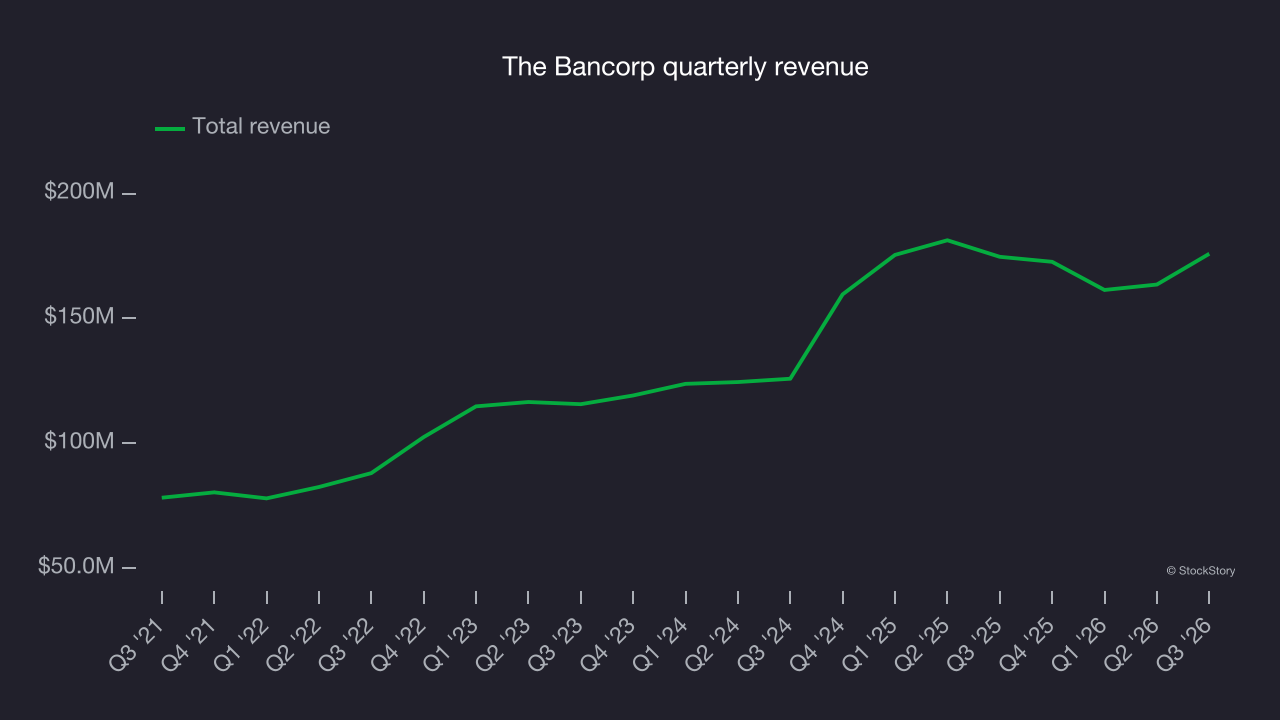
Long-term growth is the most important, but within financials, a half-decade historical view may miss recent interest rate changes and market returns. The Bancorp’s annualized revenue growth of 16.8% over the last two years aligns with its five-year trend, suggesting its demand was predictably strong. 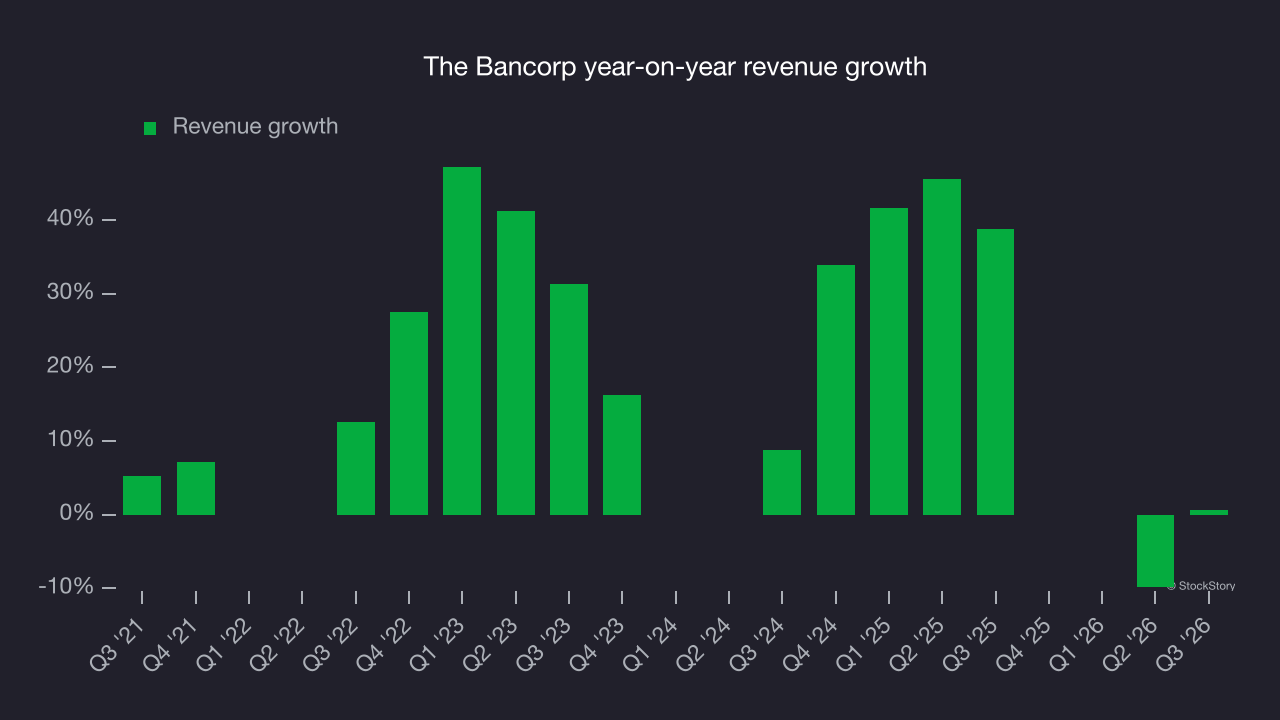 Note: Quarters not shown were determined to be outliers because they were impacted by outsized investment gains/losses that are not indicative of the recurring fundamentals of the business.
This quarter, The Bancorp’s $175.9 million of revenue was flat year on year, falling short of Wall Street’s consensus estimates.
Net interest income made up 65.5% of the company’s total revenue during the last five years, meaning lending operations are The Bancorp’s largest source of revenue.
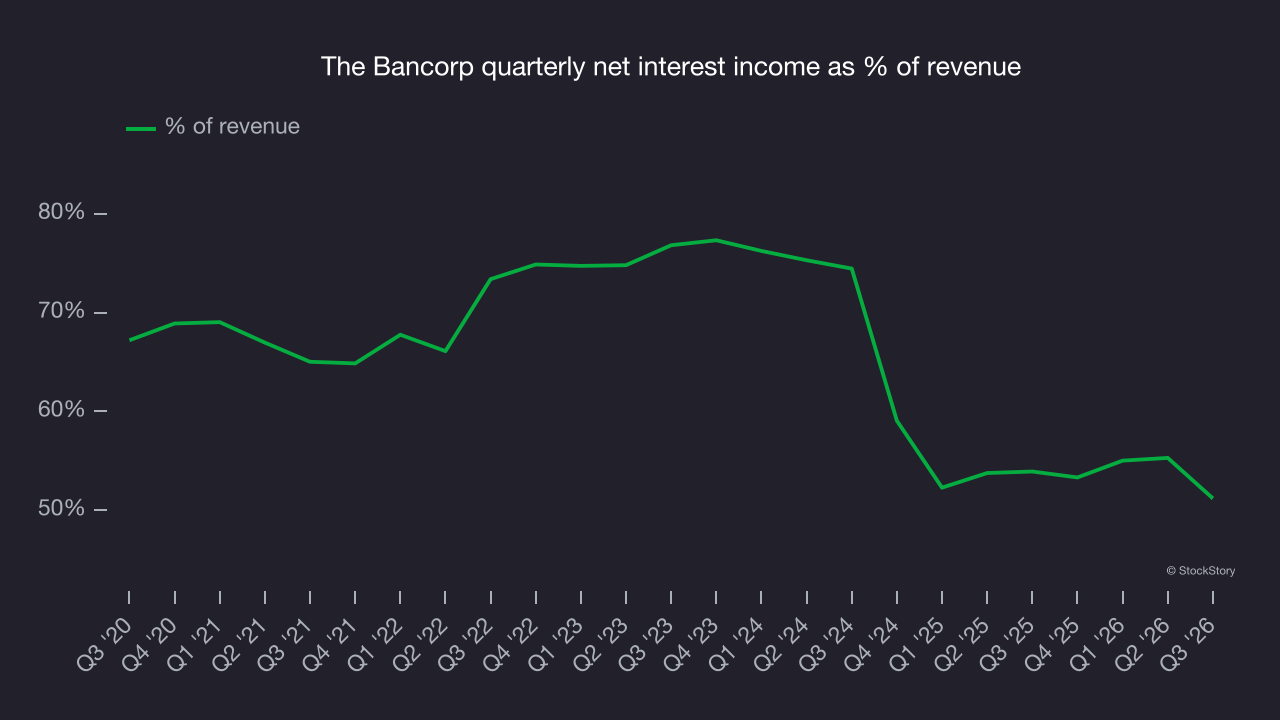
Net interest income commands greater market attention due to its reliability and consistency, whereas non-interest income is often seen as lower-quality revenue that lacks the same dependable characteristics.
Tangible book value per share (TBVPS)
The balance sheet drives banking profitability since earnings flow from the spread between borrowing and lending rates. As such, valuations for these companies concentrate on capital strength and sustainable equity accumulation potential.
This explains why tangible book value per share (TBVPS) is a leading banking metric. TBVPS excludes intangible assets of uncertain value, providing a reliable measure of tangible net worth per share. Traditional metrics like EPS are helpful but face distortion from M&A activity and loan loss accounting rules.
The Bancorp’s TBVPS grew at a strong 8.7% annual rate over the last five years. However, TBVPS growth has decelerated recently as it was flat over the last two years at roughly $16.83 per share.
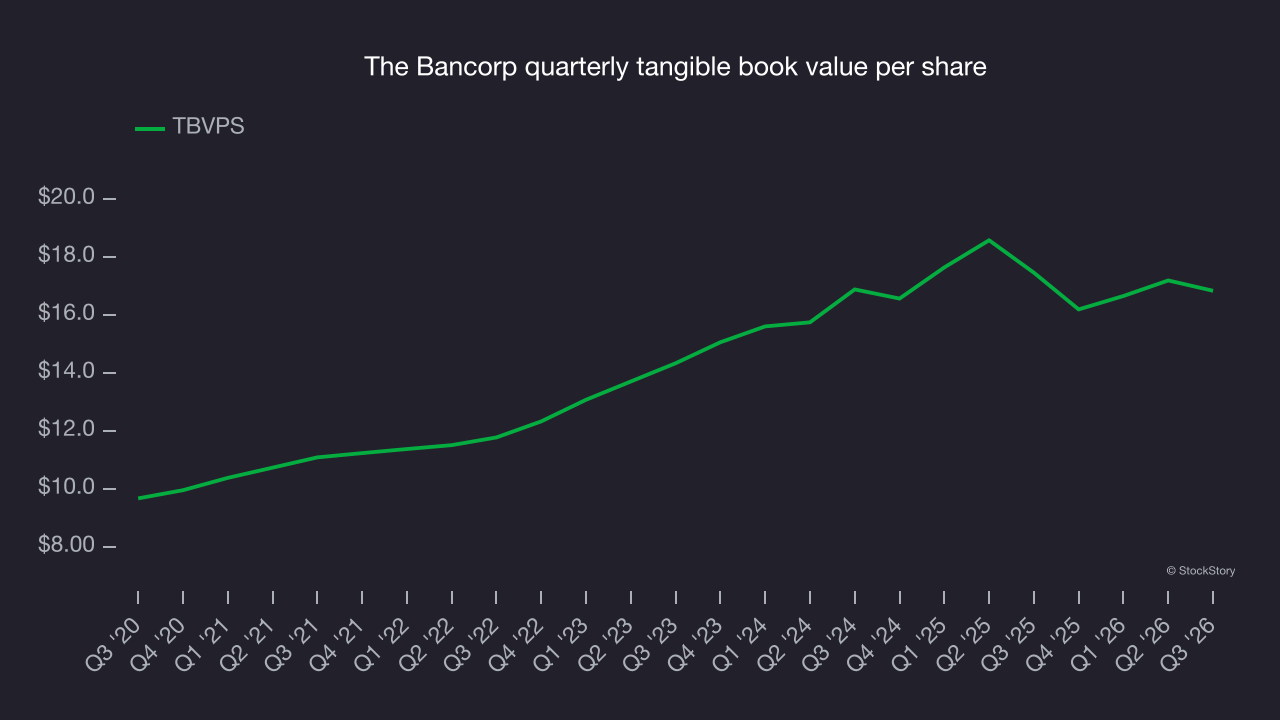
Over the next 12 months, consensus estimates call for The Bancorp’s TBVPS to grow by 20.2% to $20.23, a rapid pace of growth.
Key takeaways from The Bancorp’s Q3 results
The Bancorp’s softer quarter offered few positives, with tangible book value per share missing expectations and revenue falling slightly short of Wall Street’s consensus estimates. Shares remained flat at $50.02 immediately after the report.
The Bancorp’s latest earnings report disappointed. One quarter doesn’t define a company’s quality, so assessing the stock at its current price means considering its valuation and business quality alongside the latest results. Read more in our full research report here (it’s free).