Insurance specialty broker Ryan Specialty (NYSE: RYAN) met Wall Street’s revenue expectations in Q3 2026, with revenue rising 4.7% year on year to $790 million. Its non-GAAP profit of $0.51 per share was 5% above analysts’ consensus estimates.
For more on Ryan Specialty, read our free full research report.
Ryan Specialty (RYAN) Q3 2026 highlights:
- Revenue $790 million vs S&P analysts’ consensus estimates of $790.9 million (4.7% year-on-year growth, in line)
- Adjusted EPS $0.51 vs S&P analysts’ consensus estimates of $0.49 (5% beat)
- Adjusted EBITDA $244.4 million vs analysts’ consensus estimates of $233.1 million (30.9% margin, 4.9% beat)
- Operating margin 17.8%, up from 14.7% in the same quarter last year
- Free cash flow margin 32.2%, up from 20.6% in the same quarter last year
- Organic revenue rose 4% year on year (beat)
- Market capitalization $5.20 billion
“Our team delivered in the face of one of the most challenging markets we have ever seen, retaining high levels of existing business, winning significant new business, and building our pipelines,” added Timothy W. Turner, Chief Executive Officer of Ryan Specialty. “We continue to deliver for our clients through our differentiated talent, deep specialty expertise, and independence. We are investing in talent, technology, AI, and data that will widen our moat. We remain focused on controlling what we can control. We are well-positioned to keep winning and to create long-term value for our shareholders.”
Revenue growth
A company’s long-term revenue performance is one signal of its overall quality. Any business can deliver a good quarter or two, but the best consistently grow over the long term.
With $3.25 billion in revenue over the past 12 months, Ryan Specialty is a mid-sized business services company, which sometimes brings disadvantages compared to larger competitors benefiting from better economies of scale. On the positive side, it can still achieve high growth rates because it’s working from a smaller revenue base.
Ryan Specialty grew its revenue at a strong 18.7% compounded annual growth rate over the last five years. This shows Ryan Specialty’s demand was higher than that of many business services companies.
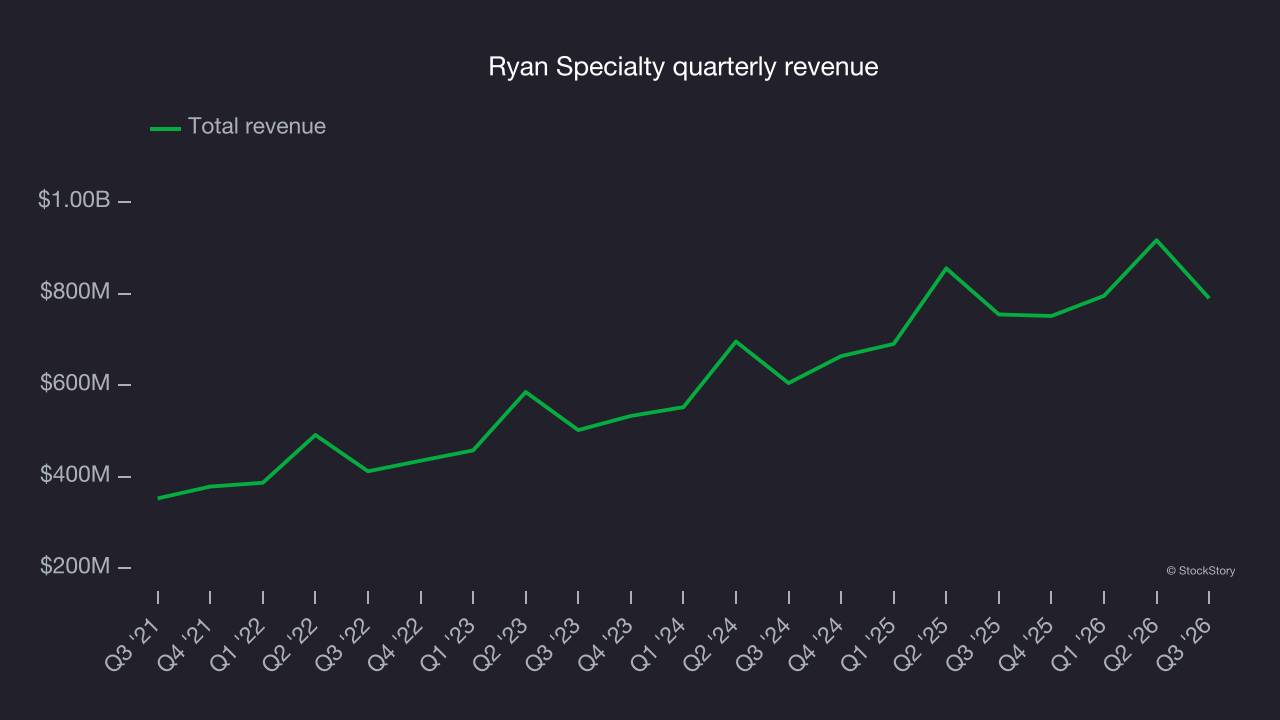
Long-term growth matters most, but within business services, a half-decade historical view may miss recent innovations or disruptive industry trends. Ryan Specialty’s annualized revenue growth of 16.8% over the last two years is below its five-year trend, but the results still suggest healthy demand. 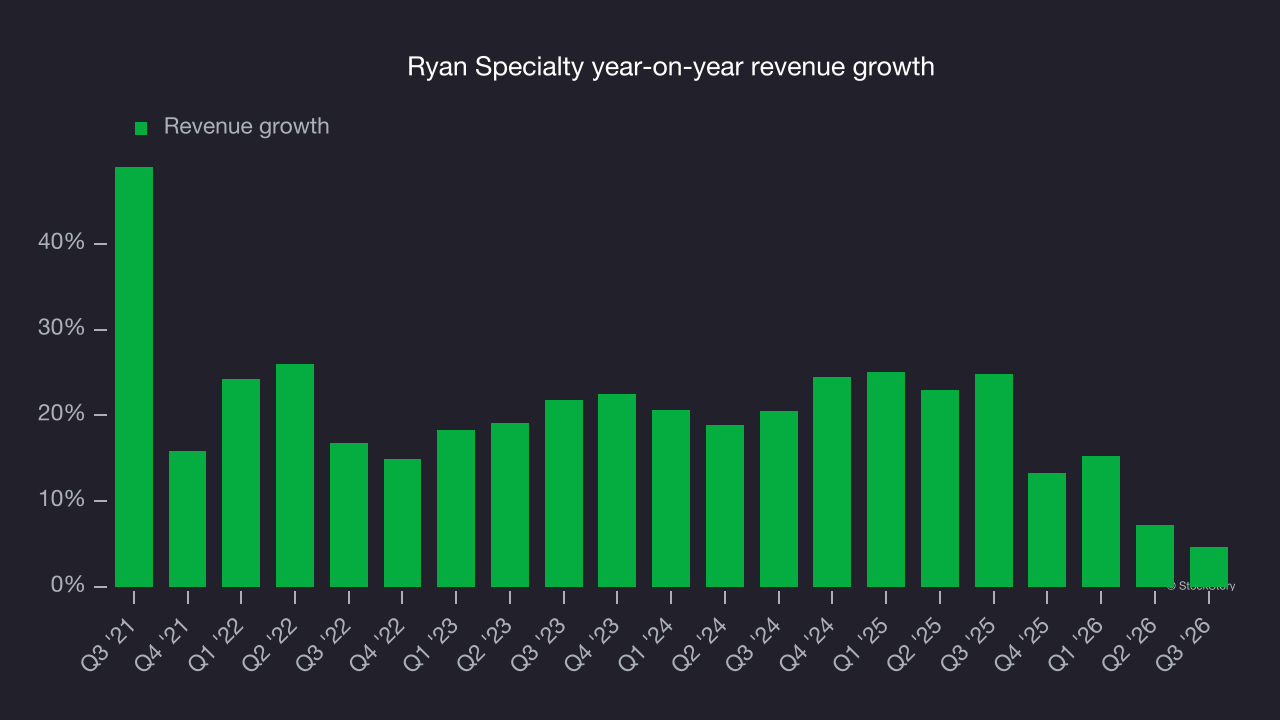
The company’s revenue dynamics become clearer by analyzing its organic revenue, which strips out one-time events like acquisitions and currency fluctuations that don’t accurately reflect its fundamentals. Over the last two years, Ryan Specialty’s organic revenue averaged 9.4% year-on-year growth. Total revenue growth outpaced organic growth over that period, indicating that some combination of acquisitions and foreign exchange rates boosted its headline results. 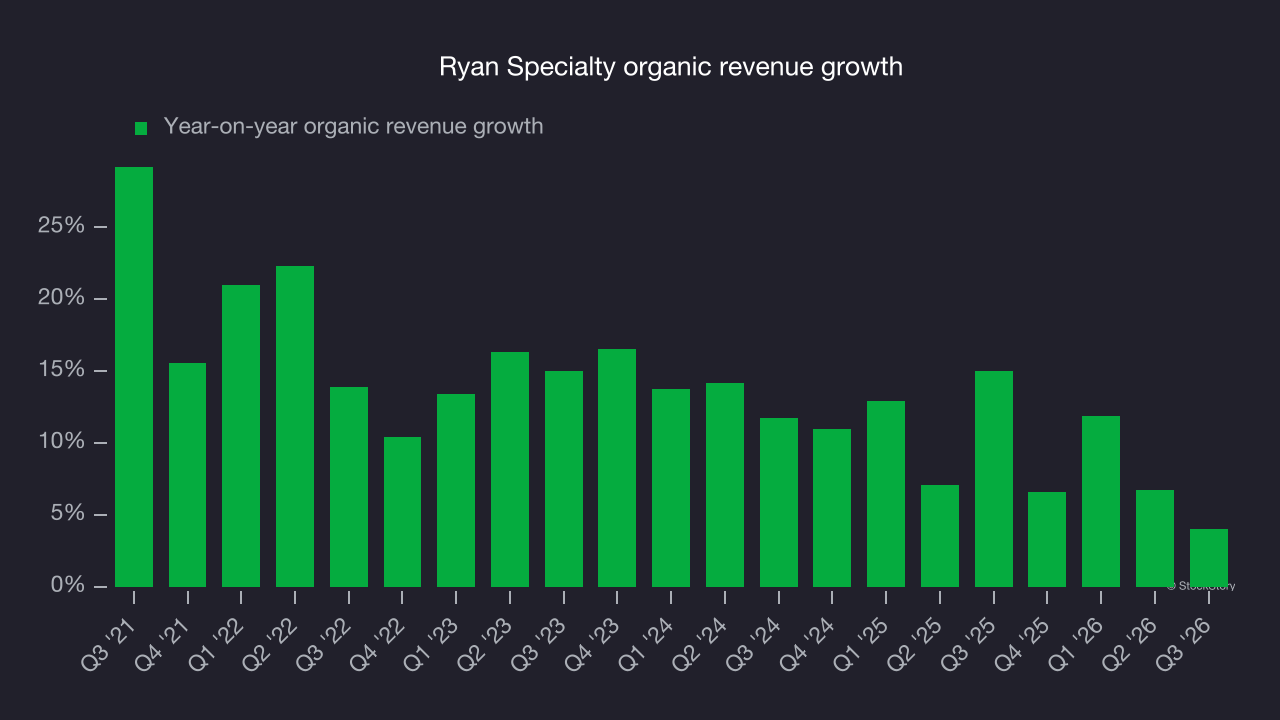
This quarter, Ryan Specialty grew its revenue by 4.7% year on year, and its $790 million of revenue was in line with Wall Street’s consensus estimates.
Looking ahead, sell-side analysts expect revenue to grow 6.9% over the next 12 months, according to S&P, a deceleration versus the last two years. Despite the slowdown, this projection is above average for the sector and implies the market sees some success for its newer products and services.
Adjusted operating margin
Ryan Specialty’s adjusted operating margin has generally stayed the same over the last 12 months, averaging 16.7% over the last five years. This profitability was strong for a business services company, showing it’s well-run with an efficient cost structure.
Analyzing the trend in its profitability, Ryan Specialty’s adjusted operating margin might have fluctuated slightly but has generally stayed the same over the last five years. This raises questions about the company’s expense base because its revenue growth should have given it leverage on its fixed costs, resulting in better economies of scale and profitability.
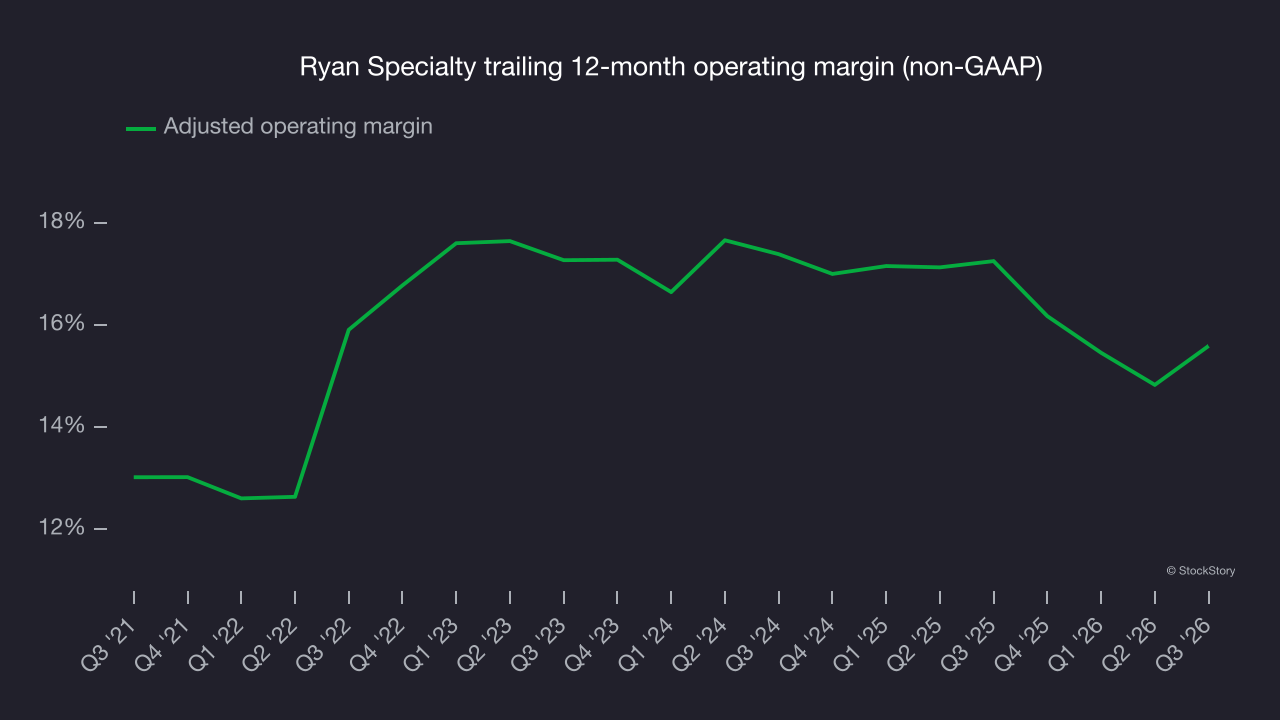
In Q3, Ryan Specialty generated an adjusted operating margin of 17.8%, up 3.1 percentage points year on year. This was a positive development, indicating greater efficiency.
Earnings per share
We track the long-term change in earnings per share (EPS) for the same reason as long-term revenue growth. Compared to revenue, however, EPS highlights whether a company’s growth is profitable.
Ryan Specialty’s EPS grew at a strong 16% compounded annual growth rate over the last five years. Despite its adjusted operating margin improvement during that time, this performance was lower than its 18.7% annualized revenue growth, indicating that non-fundamental factors such as interest and taxes affected its ultimate earnings.
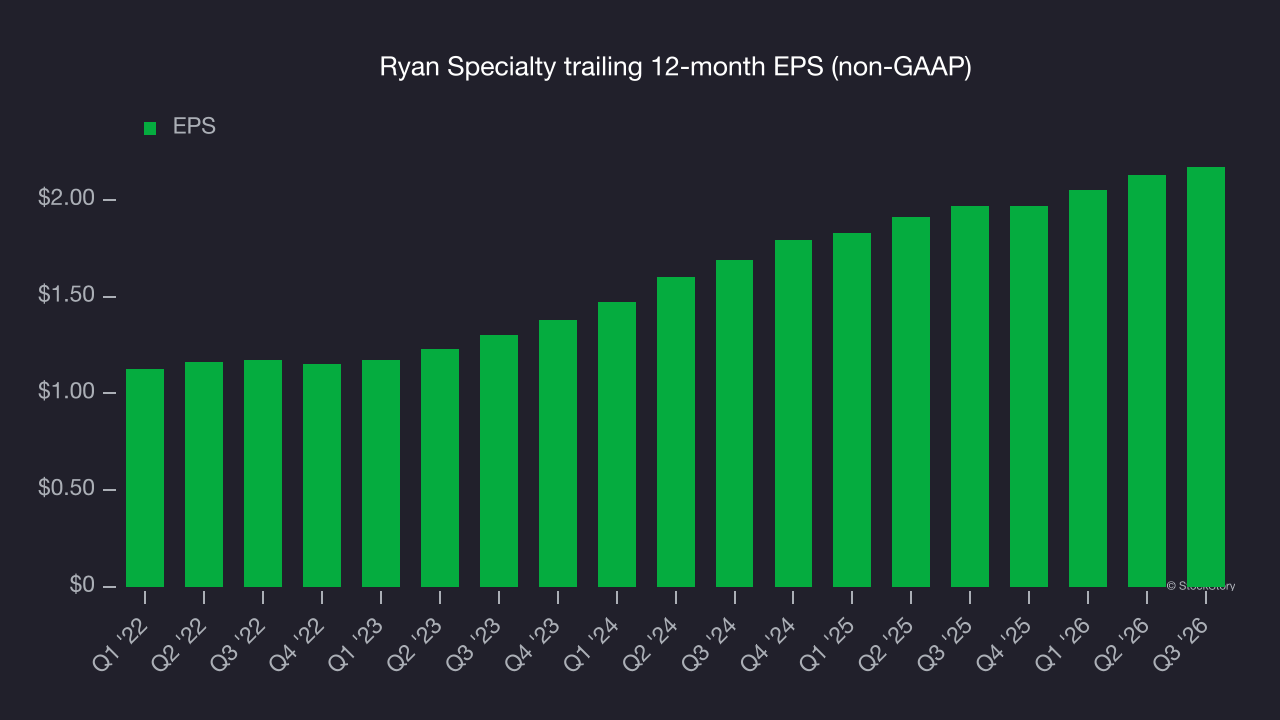
Like with revenue, we analyze EPS over a more recent period because it can provide insight into an emerging theme or development for the business.
For Ryan Specialty, its two-year annual EPS growth of 13.3% was lower than its five-year trend. Still, its growth was good.
In Q3, Ryan Specialty reported adjusted EPS of $0.51, up from $0.47 in the same quarter last year. This result beat analysts’ consensus estimates by 5%. Over the next 12 months, Wall Street expects Ryan Specialty’s full-year EPS to grow 9.2% from $2.17 to $2.37, according to S&P.
Key takeaways from Ryan Specialty’s Q3 results
Ryan Specialty’s EPS beat analysts’ consensus estimates, with organic revenue also coming in narrowly ahead of Wall Street’s consensus. Those results gave the quarter some key positives. Shares remained flat at $43.26 immediately after the release.
Assessing Ryan Specialty at its current price means considering its valuation, business quality and latest quarterly results. Read our full research report here (it’s free).