Medical tech company CONMED (NYSE: CNMD) met Wall Street’s revenue expectations in Q3 2026, but revenue was flat year on year at $335.6 million. The company’s full-year revenue outlook of $1.36 billion at the midpoint was close to analysts’ consensus estimates. Its non-GAAP profit of $1.04 per share was 3.7% above analysts’ consensus estimates.
For more on CONMED, read our free full research report.
CONMED (CNMD) Q3 2026 highlights:
- Revenue $335.6 million vs S&P analysts’ consensus estimates of $336.4 million (flat year on year, in line)
- Adjusted EPS $1.04 vs S&P analysts’ consensus estimates of $1.00 (3.7% beat)
- Adjusted EBITDA $67.88 million vs analysts’ consensus estimates of $65.98 million (20.2% margin, 2.9% beat)
- Revenue guidance The company reconfirmed its revenue guidance for the full year of $1.36 billion at the midpoint
- Adjusted EPS guidance Management slightly raised its full-year adjusted EPS guidance to $4.58 at the midpoint
- Operating margin 11.1%, rising from 3.5% in the same quarter last year
- Constant currency revenue flat year on year (6.3% in the same quarter last year)
- Market capitalization $1.41 billion
"Our third quarter organic, constant currency net sales growth was consistent with our expectations and our adjusted diluted EPS exceeded them, reflecting our team’s strong execution," said Patrick J. Beyer, CONMED’s President and Chief Executive Officer. "Importantly, our net sales growth on an organic, constant currency basis included balanced contributions from both our Orthopedic and General Surgery product lines, which were in turn powered by commercial traction across our key product growth platforms: AirSeal, Buffalo Filter, and BioBrace. Our updated full year guidance reflects this strong performance in the third quarter and our latest outlook as we close out the year."
Revenue growth
A company’s long-term revenue performance can indicate its overall quality. Any business can have short-term success, but a top-tier one grows for years. CONMED’s revenue grew at a mediocre 6.7% compounded annual growth rate over the last five years, falling short of the healthcare sector benchmark.
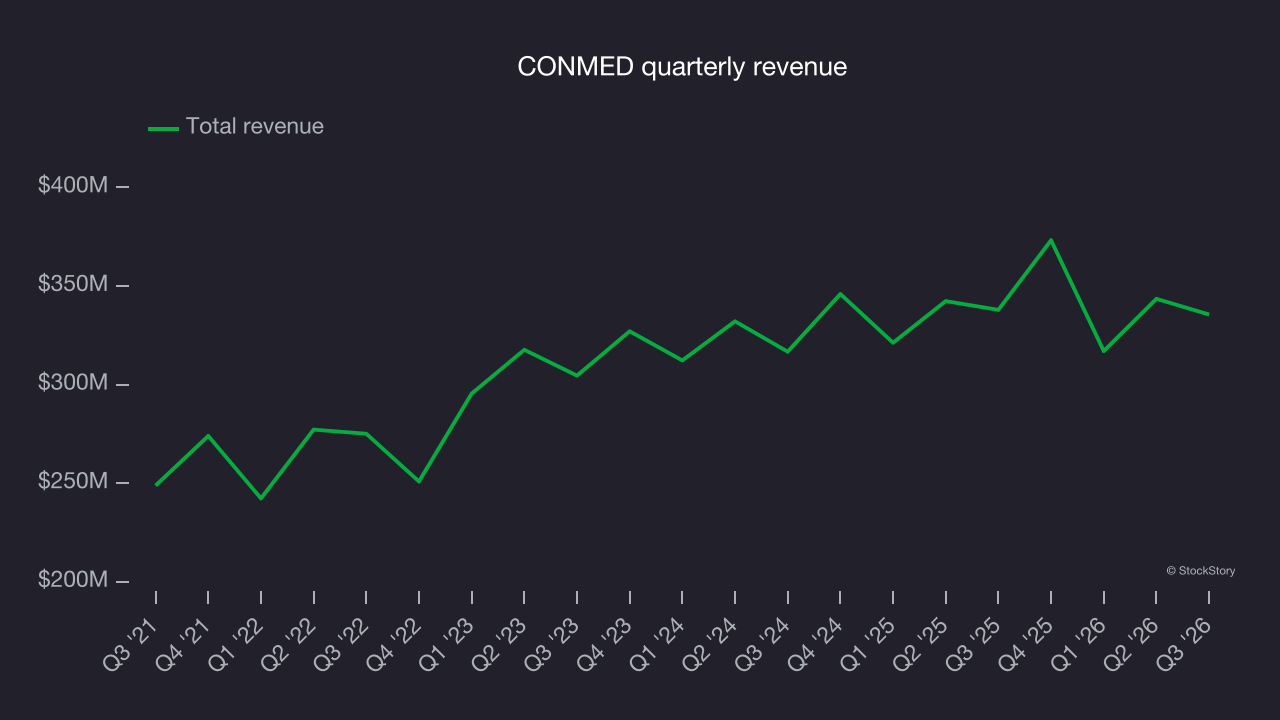
Long-term growth is the most important, but within healthcare, a half-decade historical view may miss new innovations or demand cycles. CONMED’s recent performance shows its demand has slowed as its annualized revenue growth of 3.1% over the last two years was below its five-year trend. Decelerating revenue growth in the sector is a concern, as it could signal changing consumer tastes aided by low switching costs. 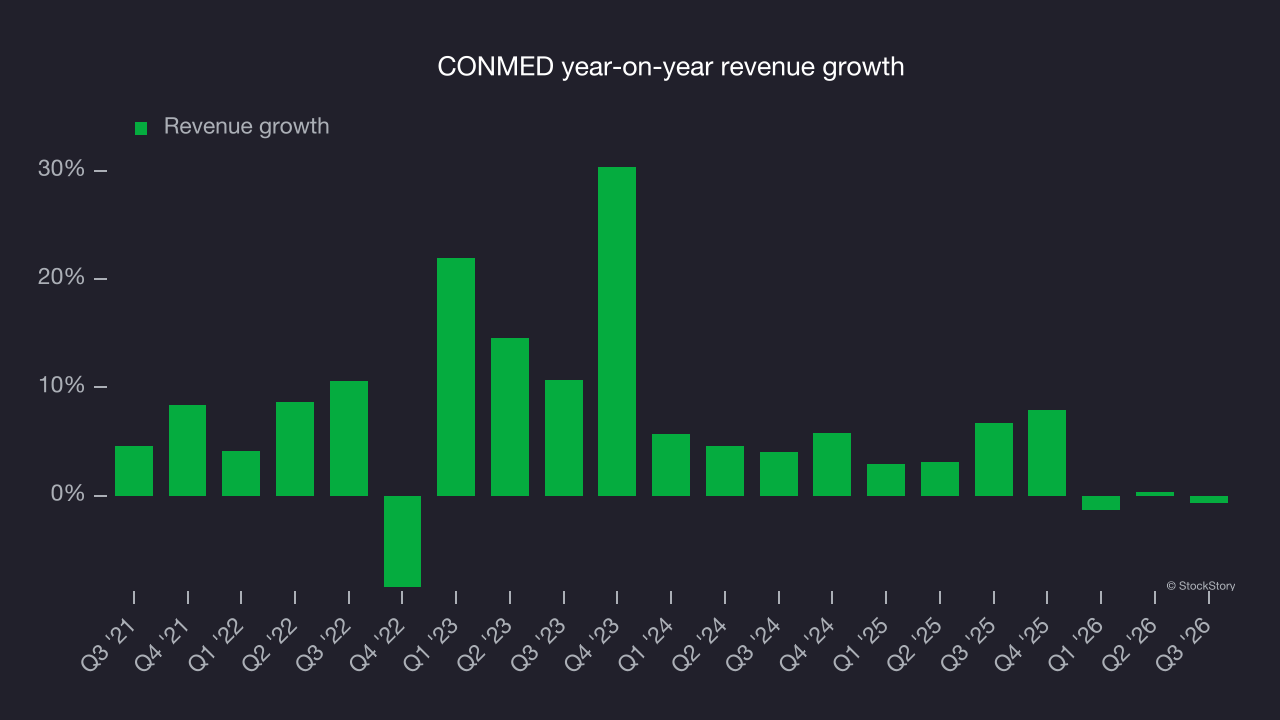
CONMED also reports revenue performance excluding currency movements, which are outside the company’s control and not indicative of demand. Over the last two years, its constant currency revenue averaged 4% year-on-year growth. This was in line with reported revenue growth, indicating that foreign exchange has not had a meaningful impact on revenue. 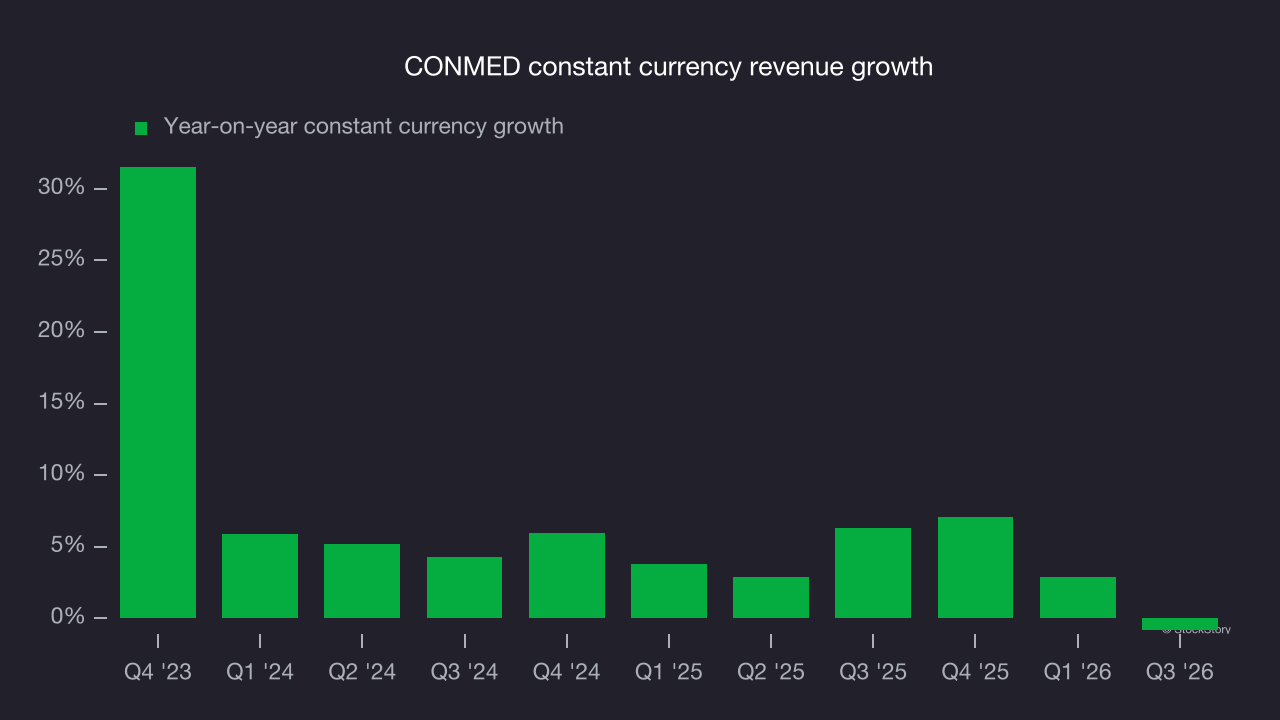
This quarter, CONMED’s $335.6 million of revenue was flat year on year and in line with Wall Street’s consensus estimates.
Looking ahead, sell-side analysts expect revenue to grow 3.3% over the next 12 months, according to S&P, similar to its two-year rate. This uninspiring projection indicates its newer products and services will not lead to better revenue performance yet.
Adjusted operating margin
Adjusted operating margin is one of the best measures of profitability because it tells us how much money a company takes home after subtracting all core expenses, like marketing and R&D. It also removes various one-time costs to paint a better picture of normalized profits.
CONMED has done a decent job managing its cost base over the last five years. The company has produced an average adjusted operating margin of 14.7%, higher than the broader healthcare sector.
Looking at the trend in its profitability, CONMED’s adjusted operating margin rose by 1.4 percentage points over the last five years, as its revenue growth gave it operating leverage.
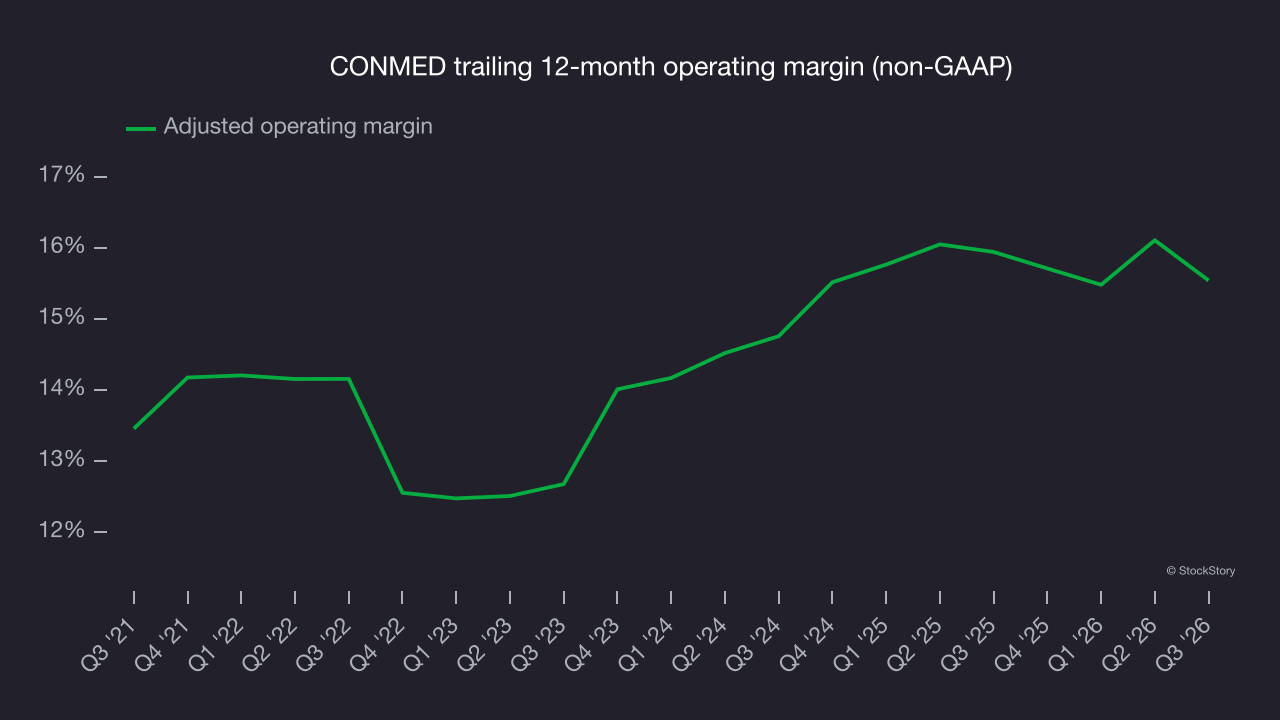
This quarter, CONMED generated an adjusted operating margin of 12.8%, down 2.3 percentage points year on year. This contraction shows it was less efficient because its expenses increased relative to its revenue.
Earnings per share
Revenue trends explain a company’s historical growth, but the long-term change in earnings per share (EPS) points to the profitability of that growth – for example, a company could inflate its revenue through excessive spending on advertising and promotions.
CONMED’s EPS grew at a 9.7% compounded annual growth rate over the last five years, higher than its 6.7% annualized revenue growth. This indicates the company became more profitable on a per-share basis as it expanded.
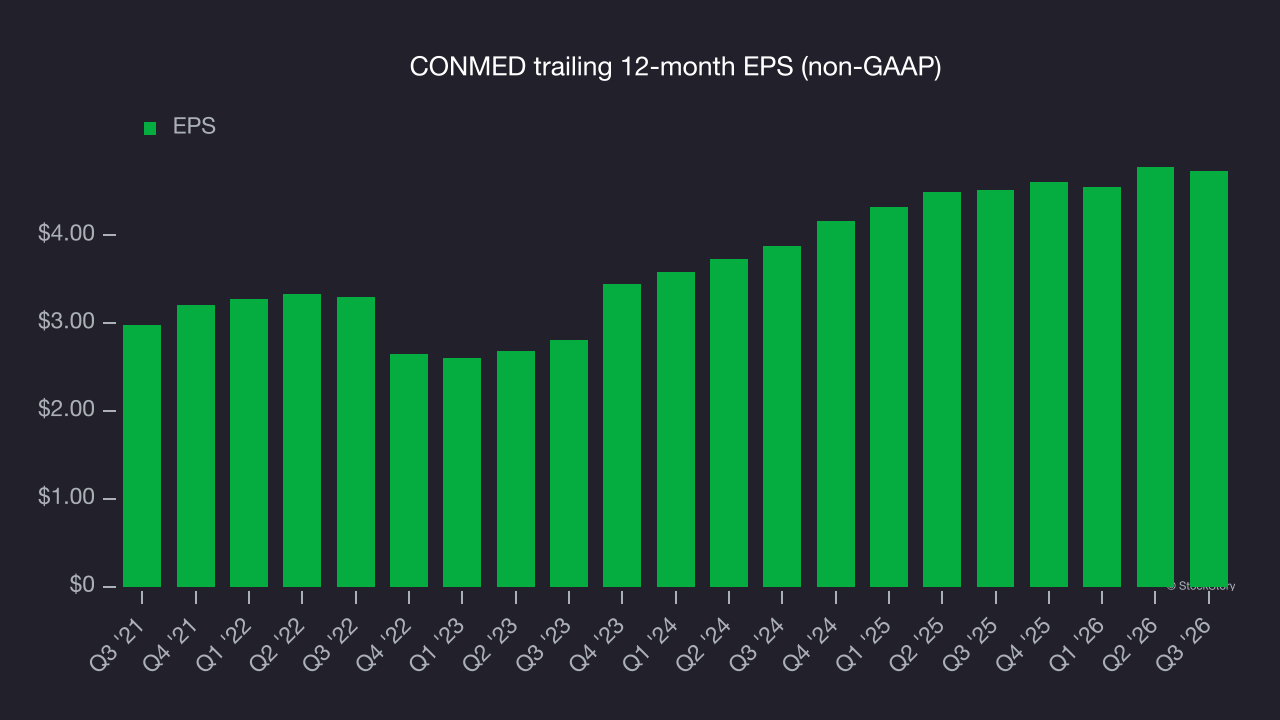
A closer look at CONMED’s quality of earnings helps explain its performance. As mentioned earlier, CONMED’s adjusted operating margin declined this quarter but expanded by 1.4 percentage points over the last five years. Its share count also shrank by 6.3%, and these factors together are positive signs for shareholders because improving profitability and share buybacks boost EPS growth relative to revenue growth. 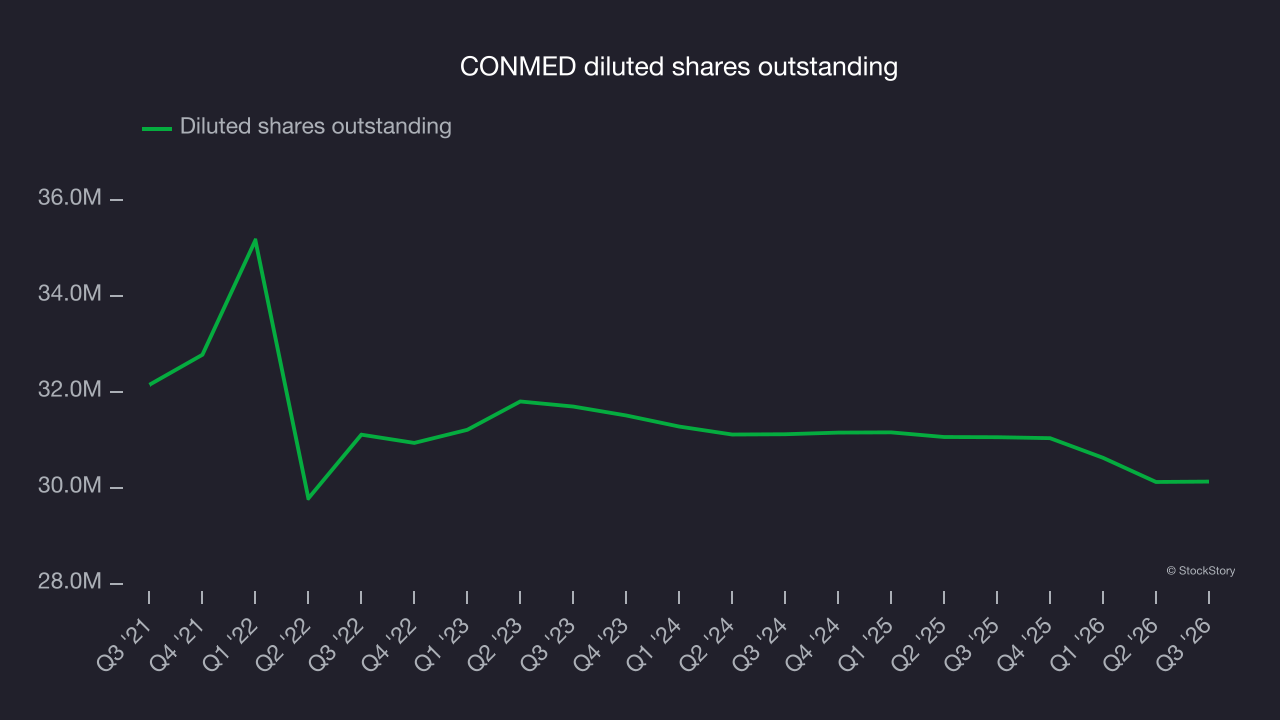
In Q3, CONMED reported adjusted EPS of $1.04, down from $1.08 in the same quarter last year. Despite falling year on year, EPS beat analysts’ consensus estimates by 3.7%. Over the next 12 months, Wall Street expects CONMED’s full-year EPS to shrink by 2.1% from $4.74 to $4.64, according to S&P.
Key takeaways from CONMED’s Q3 results
CONMED’s Q3 report was mixed, with EPS topping Wall Street’s consensus estimates and full-year EPS guidance narrowly ahead of analysts’ consensus estimates. Revenue, however, was in line with expectations. Shares remained flat at $45.63 immediately after the results.
The latest quarter matters, but not nearly as much as longer-term fundamentals and valuation when deciding whether CONMED is a buy at its current price. Read the full research report here (it’s free).