Electronics manufacturing services provider Benchmark (NYSE: BHE) reported Q3 2026 results beating Wall Street’s revenue expectations, with revenue up 19.1% year on year to $810.9 million. Next quarter’s revenue guidance ($835 million at the midpoint) was surprisingly strong, at 4.9% above analysts’ consensus estimates. Its non-GAAP profit of $0.84 per share was 6.8% above analysts’ consensus estimates.
For more on Benchmark, read our full research report, available free.
Benchmark (BHE) Q3 2026 highlights:
- Revenue $810.9 million vs S&P analysts’ consensus estimates of $775.5 million (19.1% year-on-year growth, 4.6% beat)
- Adjusted EPS $0.84 vs S&P analysts’ consensus estimates of $0.79 (6.8% beat)
- Revenue guidance $835 million at the midpoint for Q4 2026, above analysts’ consensus estimates of $796.3 million
- Adjusted EPS guidance $0.88 at the midpoint for Q4 2026, above analysts’ consensus estimates of $0.83
- Operating margin 3.8%, in line with the same quarter last year
- Free cash flow margin 1.8%, down from 3.7% in the same quarter last year
- Market capitalization $2.54 billion
Moezidis continued, "Demand is broadening across our portfolio, bookings momentum remains healthy, and our teams continue to execute at a high level. As a result, we delivered record quarterly revenue, grew earnings at nearly twice the rate of sales, and are once again raising our outlook for the year. We now expect 2026 revenue growth of approximately 16%, further increasing our outlook beyond the $3 billion annual revenue level we established last quarter."
Revenue growth
A company’s long-term revenue performance is one signal of its overall quality. Any business can deliver a good quarter or two, but many enduring ones grow for years.
With $2.95 billion in revenue over the past 12 months, Benchmark is a mid-sized business services company, which sometimes brings disadvantages compared to larger competitors benefiting from better economies of scale. On the positive side, it can still achieve high growth rates because it’s working from a smaller revenue base.
Benchmark’s 6.6% annualized revenue growth over the last five years was decent. This shows its offerings generated slightly more demand than the average business services company.
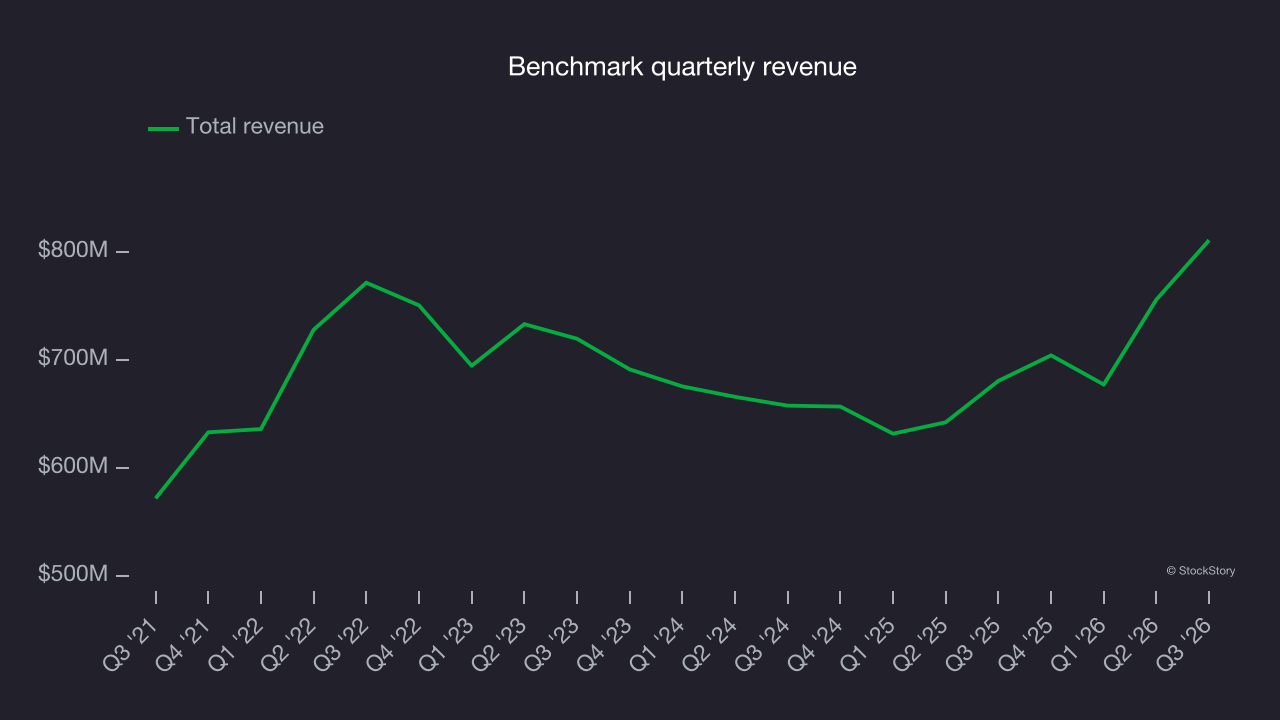
Long-term growth matters most, but within business services, a half-decade historical view may miss recent innovations or disruptive industry trends. Benchmark’s recent performance shows its demand has slowed as its annualized revenue growth of 4.7% over the last two years was below its five-year trend. Decelerating revenue growth in the sector warrants caution, as it could signal changing consumer tastes aided by low switching costs. 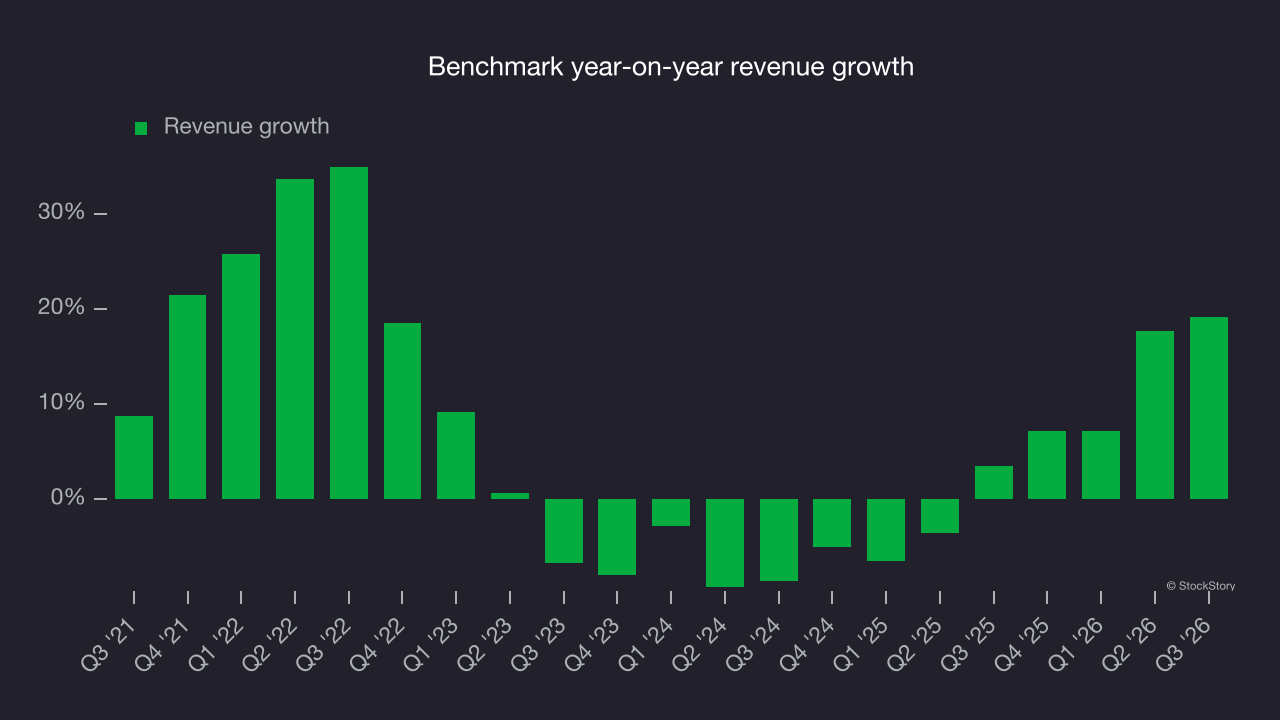
This quarter, Benchmark reported year-on-year revenue growth of 19.1%, and its $810.9 million of revenue exceeded Wall Street’s consensus estimates by 4.6%. Company management is currently guiding for an 18.6% year-on-year increase in revenue next quarter.
Looking further ahead, sell-side analysts expect revenue to grow 8.5% over the next 12 months, according to S&P, an improvement versus the last two years. This projection is healthy and implies its newer products and services will fuel better top-line performance.
Adjusted operating margin
Benchmark was profitable over the last five years but held back by its large cost base. Its average adjusted operating margin of 4.6% was weak for a business services company.
On the positive side, Benchmark’s adjusted operating margin rose by 1.2 percentage points over the last five years, as its revenue growth gave it operating leverage.
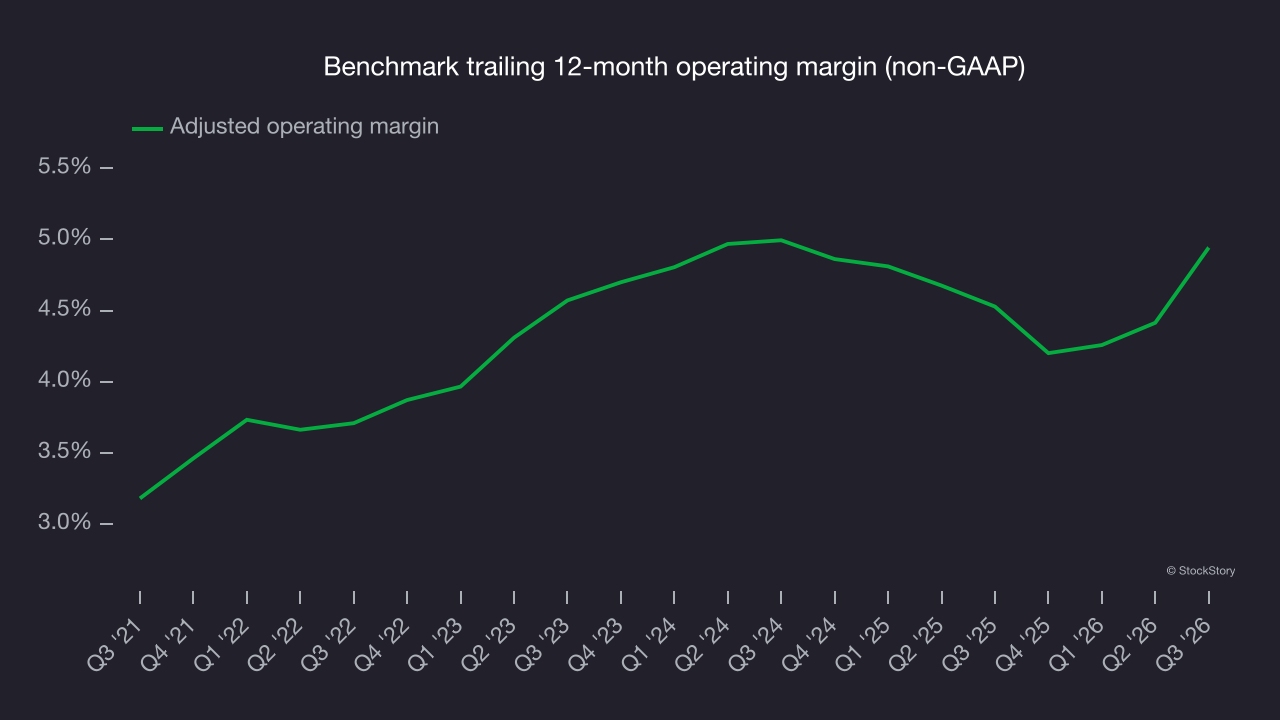
This quarter, Benchmark generated an adjusted operating margin of 6.4%, up 1.9 percentage points year on year. This was a positive development, showing improved efficiency.
Earnings per share
We track the long-term change in earnings per share (EPS) for the same reason as long-term revenue growth. Compared to revenue, however, EPS highlights whether a company’s growth is profitable.
Benchmark’s EPS grew at an 18.9% compounded annual growth rate over the last five years, higher than its 6.6% annualized revenue growth. This tells us the company became more profitable on a per-share basis as it expanded.
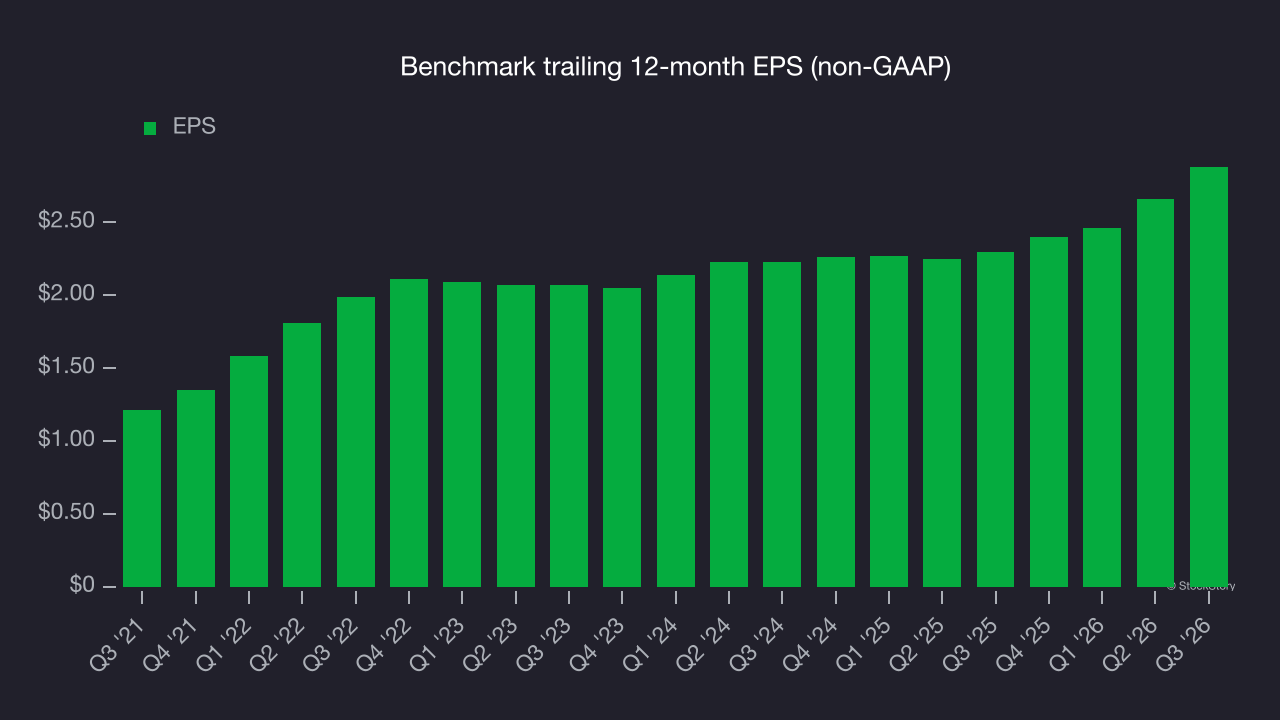
We can take a deeper look into Benchmark’s earnings to better understand the drivers of its performance. As we mentioned earlier, Benchmark’s adjusted operating margin expanded by 1.2 percentage points over the last five years. This was the most relevant factor (aside from the revenue impact) behind its higher earnings; interest expenses and taxes can also affect EPS but don’t tell us as much about a company’s fundamentals.
Like with revenue, we analyze EPS over a more recent period because it can provide insight into an emerging theme or development for the business.
For Benchmark, its two-year annual EPS growth of 13.6% was lower than its five-year trend. Growth was still good, but an acceleration would be welcome.
In Q3, Benchmark reported adjusted EPS of $0.84, up from $0.62 in the same quarter last year. This result beat analysts’ consensus estimates by 6.8%. Over the next 12 months, Wall Street expects Benchmark’s full-year EPS to grow 15.6% from $2.88 to $3.33, according to S&P.
Key takeaways from Benchmark’s Q3 results
Benchmark’s outlook stood out in a solid Q3 report: next-quarter EPS guidance came in well above analysts’ consensus estimates, and revenue guidance also topped Wall Street’s consensus. Investors were likely hoping for more, however. Shares fell 2.7% to $71.38 immediately after reporting.
Is Benchmark a buy at its current price? The latest quarter is only one factor in assessing longer-term business quality. Quality, combined with valuation, can help determine whether the stock is a buy. For more on these factors, read the full research report here (it’s free).