Commercial vehicle retailer Rush Enterprises (NASDAQ: RUSH.A) reported Q3 2026 results beating Wall Street’s revenue expectations, with revenue up 12.4% year on year to $2.11 billion. Its GAAP profit of $0.65 per share was in line with analysts’ consensus estimates.
For more on Rush Enterprises, read our free full research report.
Rush Enterprises (RUSHA) Q3 2026 highlights:
- Revenue $2.11 billion vs S&P analysts’ consensus estimates of $2.05 billion (12.4% year-on-year growth, 3.3% beat)
- EPS (GAAP) $0.65 vs analysts’ consensus estimates of $0.65 (in line)
- Operating margin 5.1%, in line with the same quarter last year
- Market capitalization $5.62 billion
“Our current backlog suggests that our new commercial vehicle sales will be strong in the fourth quarter and into the first quarter of 2027, although supply capacity constraints may affect the timing of deliveries. However, quoting and new order activity have slowed recently as the industry awaits the EPA’s final rules with respect to its 2027 emissions regulations. Until the rules are finalized, manufacturer pricing for 2027 may continue to be fluid, which will likely result in customers delaying purchasing decisions. On a positive note, while the timing of future orders for commercial vehicles remains uncertain, we believe that industry demand for new Class 8 trucks is still healthy and that orders will pick up shortly after the EPA finalizes its rules. We further believe that we are well positioned to serve customers with their near-term equipment needs once they have the necessary information from both the EPA and manufacturers to plan their vehicle replacement strategy,” he explained.
Revenue growth
A company’s long-term performance is an indicator of its overall quality. Even a bad business can perform well for one or two quarters, but a top-tier one grows for years. Rush Enterprises’s 8% annualized revenue growth over the last five years was decent. Its growth was slightly above the average industrials company and shows its offerings resonate with customers.
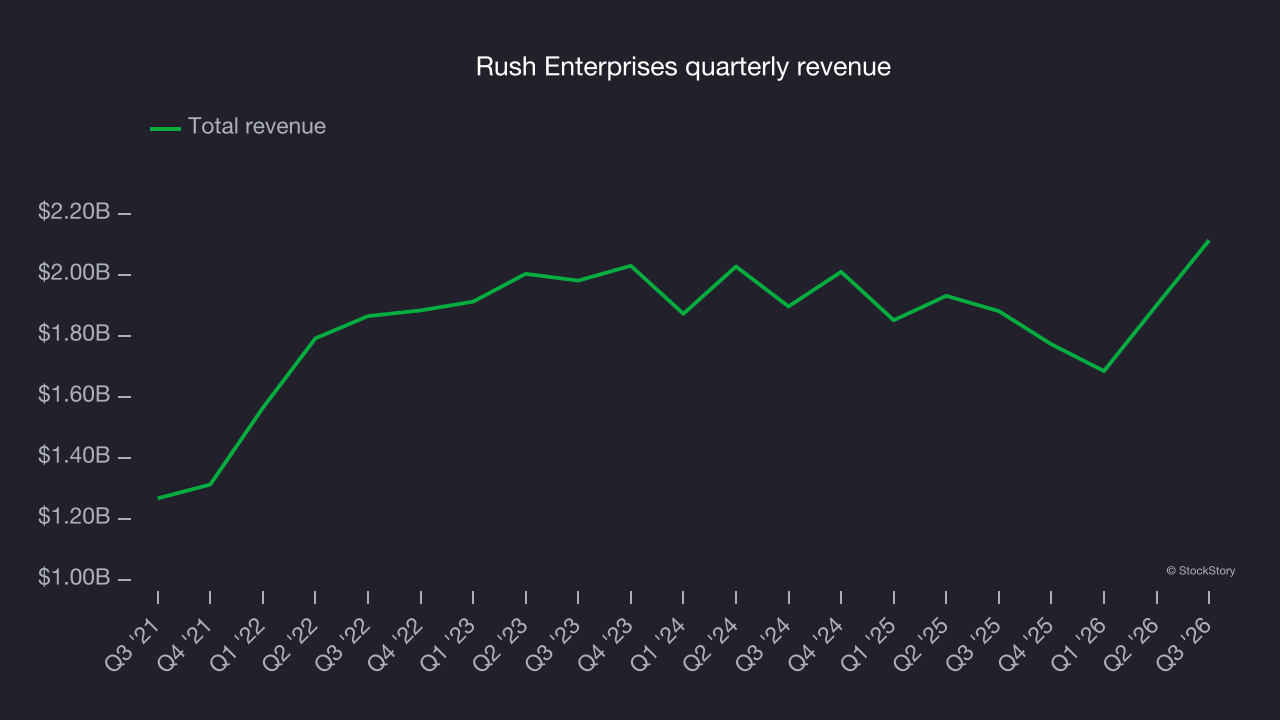
Long-term growth matters most, but within industrials, a half-decade historical view may miss cycles, industry trends or a company capitalizing on catalysts such as a new contract win or a successful product line. Rush Enterprises’s recent performance marks a sharp pivot from its five-year trend as its revenue has shown annualized declines of 2.3% over the last two years. 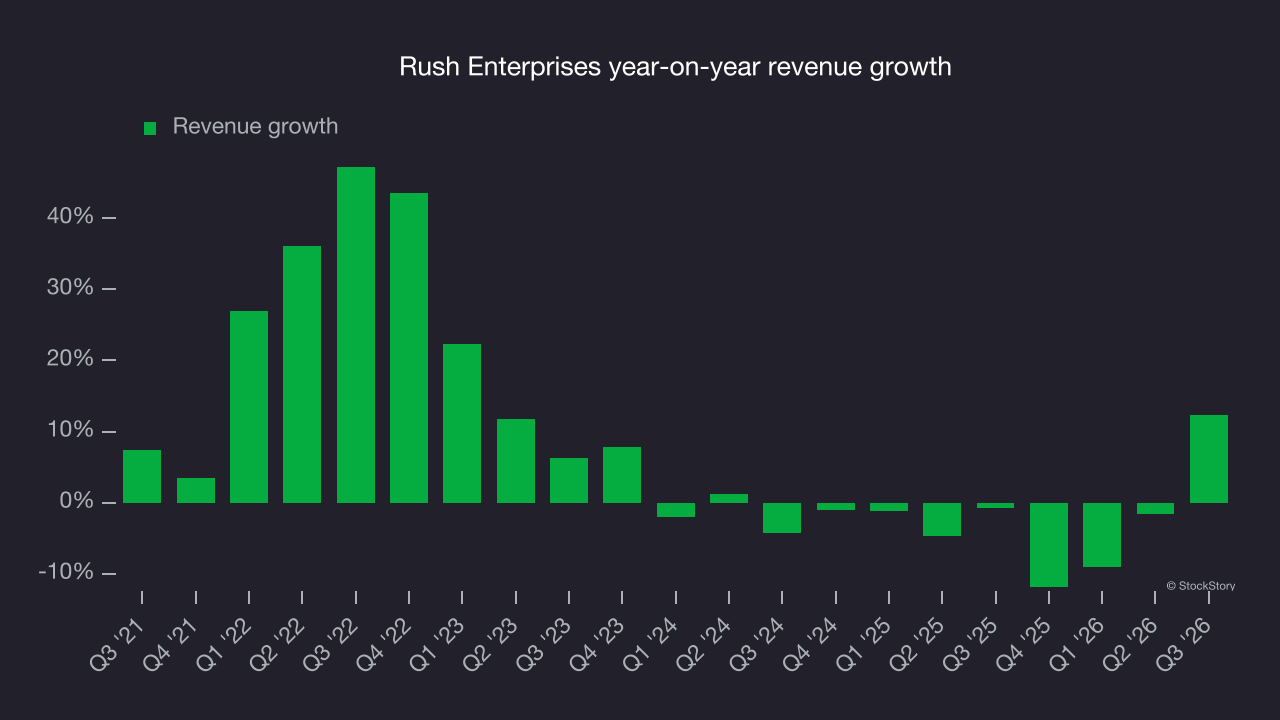
Rush Enterprises also breaks out the revenue for its most important segments, Vehicles and Aftermarket, which are 62.7% and 32.2% of revenue. Over the last two years, Rush Enterprises’s Vehicles revenue (new and used commercial trucks) averaged 5.5% year-on-year declines while its Aftermarket revenue (parts and services) averaged 9% declines. 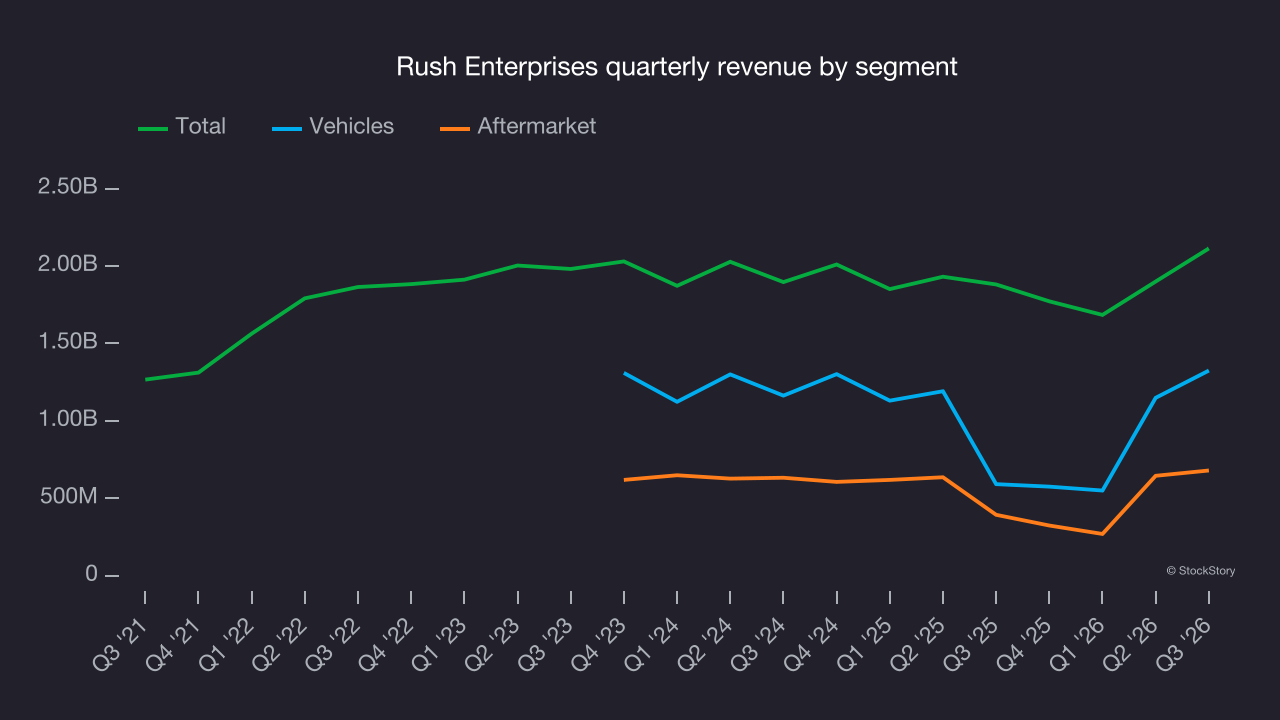
This quarter, Rush Enterprises reported year-on-year revenue growth of 12.4%, and its $2.11 billion of revenue exceeded Wall Street’s consensus estimates by 3.3%.
Looking ahead, sell-side analysts expect revenue to grow 14.7% over the next 12 months, according to S&P, an improvement versus the last two years. The projected growth is strong and indicates its newer products and services will fuel better top-line performance.
Operating margin
Operating margin is an important measure of profitability as it shows the portion of revenue left after accounting for all core expenses, from the cost of goods sold to advertising and wages. It’s also useful for comparing profitability across companies with different levels of debt and tax rates because it excludes interest and taxes.
Rush Enterprises was profitable over the last five years but held back by its large cost base. Its average operating margin of 6% was weak for an industrials business. That outcome is unsurprising given its low gross margin baseline.
Looking at the trend in its profitability, Rush Enterprises’s operating margin decreased by 1.9 percentage points over the last five years. This raises questions about the company’s expense base because its revenue growth should have given it leverage on its fixed costs, resulting in better economies of scale and profitability. Rush Enterprises’s performance was poor, showing that costs were rising and it couldn’t pass them on to its customers.
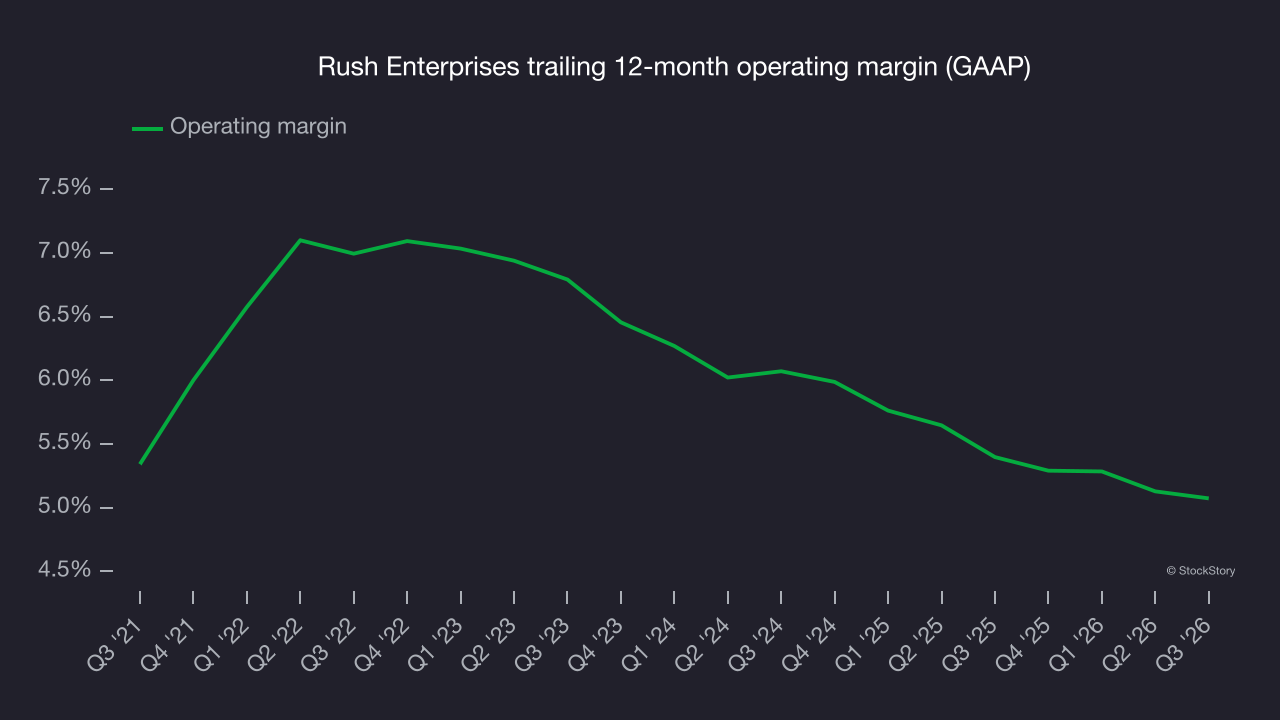
In Q3, Rush Enterprises reported an operating margin of 5.1%, in line with the same quarter last year. This indicates the company’s cost structure has recently been stable.
Earnings per share
We track the long-term change in earnings per share (EPS) for the same reason as long-term revenue growth. Compared to revenue, however, EPS highlights whether a company’s growth is profitable.
Rush Enterprises’s unimpressive 7% annual EPS growth over the last five years aligns with its revenue performance. This tells us it maintained its per-share profitability as it expanded.
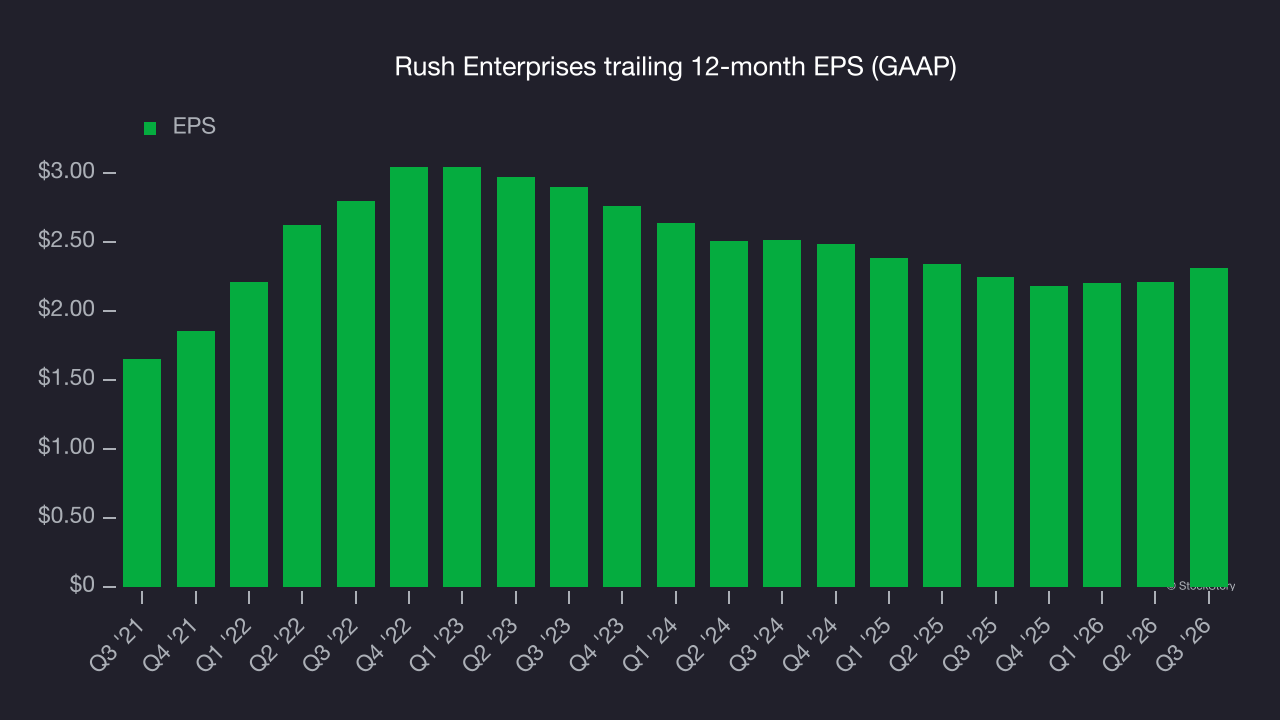
Like with revenue, we analyze EPS over a more recent period because it can provide insight into an emerging theme or development for the business.
For Rush Enterprises, its two-year annual EPS declines of 4.1% show it’s continued to underperform. These were poor results.
In Q3, Rush Enterprises reported EPS of $0.65, up from $0.55 in the same quarter last year. This result was close to analysts’ consensus estimates. Over the next 12 months, Wall Street expects Rush Enterprises’s full-year EPS to grow 31.1% from $2.31 to $3.03, according to S&P.
Key takeaways from Rush Enterprises’s Q3 results
Rush Enterprises delivered a solid quarter, with revenue topping analysts’ consensus estimates as one of the key positives. Shares remained flat at $45.90 immediately after the results.
Rush Enterprises had a solid quarter, but one earnings result doesn’t necessarily make the stock a buy. The latest quarter is only one piece of the longer-term business quality puzzle. Quality, when combined with valuation, can help determine if the stock is a buy. For more on Rush Enterprises, read our full research report here (it’s free).