Electrical and electronic products company Hubbell (NYSE: HUBB) reported Q3 2026 results beating Wall Street’s revenue expectations, with revenue up 24.6% year on year to $1.87 billion. Its non-GAAP profit of $5.91 per share was 2.7% above analysts’ consensus estimates.
For more on Hubbell, read the full research report for free.
Hubbell (HUBB) Q3 2026 highlights:
- Revenue $1.87 billion vs S&P analysts’ consensus estimates of $1.86 billion (24.6% year-on-year growth, 0.7% beat)
- Adjusted EPS $5.91 vs S&P analysts’ consensus estimates of $5.75 (2.7% beat)
- Adjusted EBITDA $506.9 million vs analysts’ consensus estimates of $494.6 million (27.1% margin, 2.5% beat)
- Adjusted EPS guidance Management slightly raised its full-year adjusted EPS guidance to $20.50 at the midpoint
- Operating margin 21.8%, in line with the same quarter last year
- Free cash flow margin 15%, down from 16.9% in the same quarter last year
- Organic revenue rose 11.3% year on year (miss)
- Market capitalization $24.27 billion
Mr. Bakker continued, “Third quarter results were highlighted by >20% organic growth in Electrical Solutions, led by strong datacenter markets and bolstered by content gains and capacity expansion investments. NSI results were strong in the quarter, and performance and integration efforts are trending ahead of our initial expectations. Utility Solutions delivered solid organic growth in the quarter, led by distribution, transmission and substation markets. Orders and end market demand remained strong, driving continued backlog build in the quarter, and we remain focused on proactively investing in capacity expansion to serve our customers in high growth areas.”
Revenue growth
A company’s long-term revenue performance is one signal of its overall quality. Any business can put up a good quarter or two, but many enduring ones grow for years. Over the last five years, Hubbell grew its revenue at a solid 10.5% compounded annual growth rate. Its growth surpassed the average industrials company and shows its offerings resonate with customers.
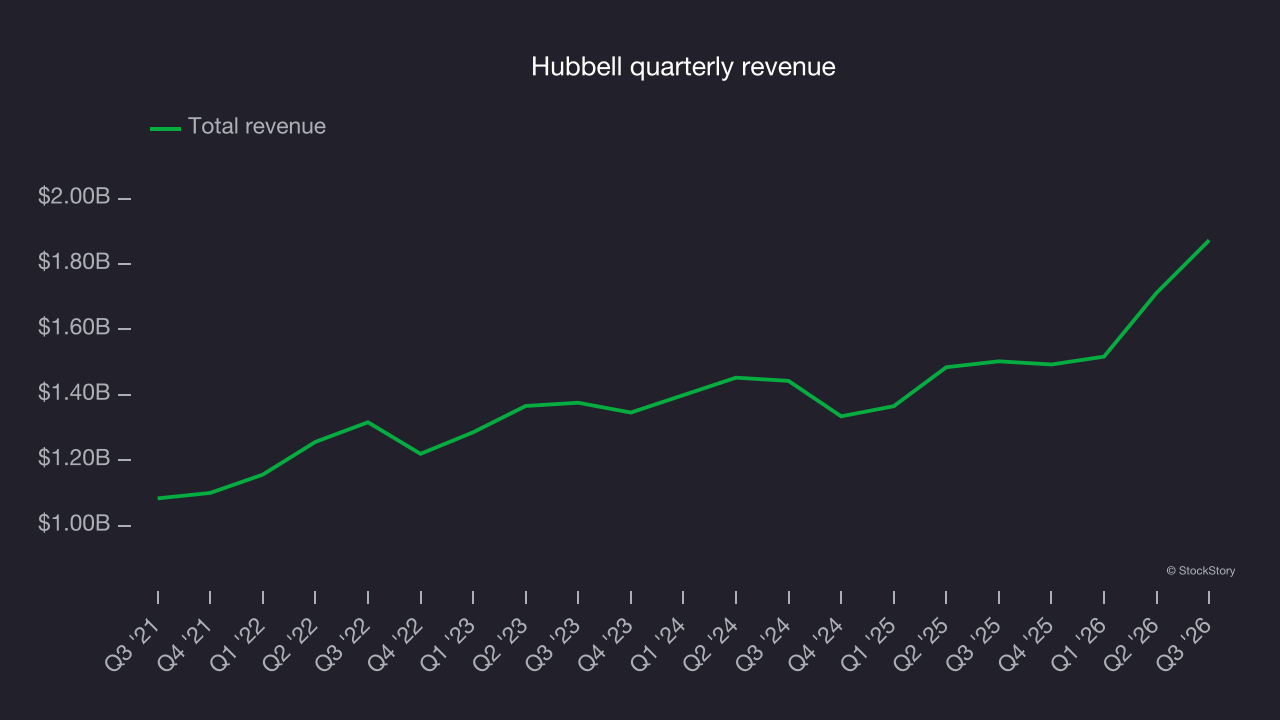
Long-term growth is the most important, but within industrials, a half-decade historical view may miss new industry trends or demand cycles. Hubbell’s annualized revenue growth of 8.1% over the last two years is below its five-year trend, but the results were still respectable. 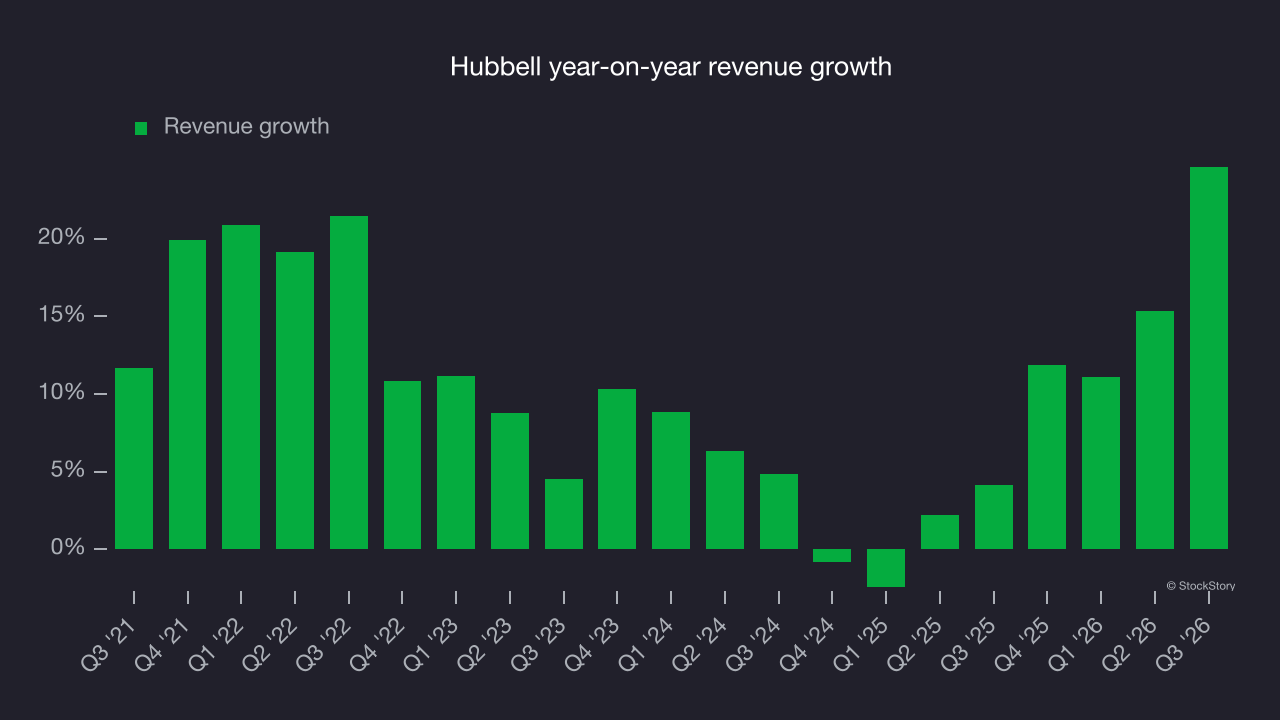
The company’s revenue dynamics become clearer through its organic revenue, which strips out one-time events like acquisitions and currency fluctuations that don’t accurately reflect its fundamentals. Over the last two years, Hubbell’s organic revenue averaged 5% year-on-year growth. Total revenue growth outpaced organic growth over that period, indicating that a combination of acquisitions and foreign exchange rates boosted its headline results. 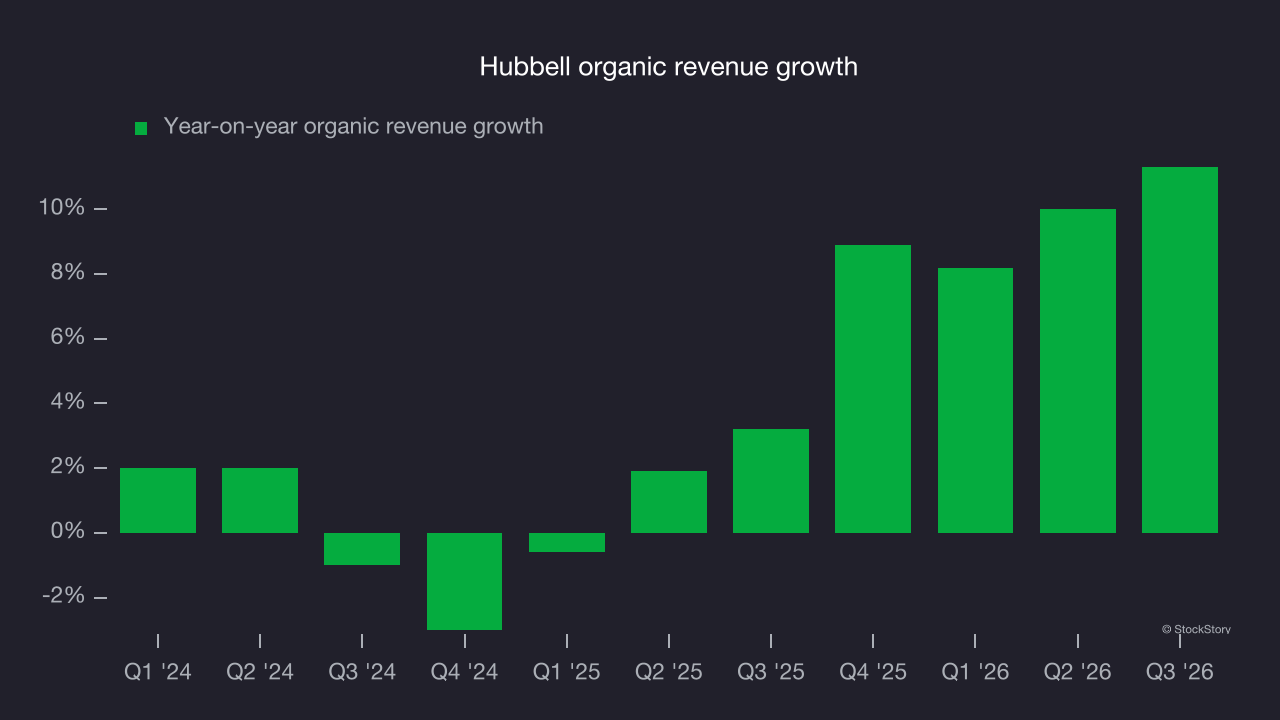
This quarter, Hubbell reported strong year-on-year revenue growth of 24.6%, and its $1.87 billion of revenue topped Wall Street’s consensus estimates by 0.7%.
Looking ahead, sell-side analysts expect revenue to grow 13.3% over the next 12 months, according to S&P, an improvement versus the last two years. This projection is noteworthy and suggests its newer products and services will fuel better top-line performance.
Operating margin
Hubbell has performed well over the last five years. It demonstrated high profitability for an industrials business, with an average operating margin of 18.6%. That result is unsurprising given its favorable gross margin baseline.
Looking at the trend in its profitability, Hubbell’s operating margin rose by 6.3 percentage points over the last five years, as its revenue growth provided substantial operating leverage.
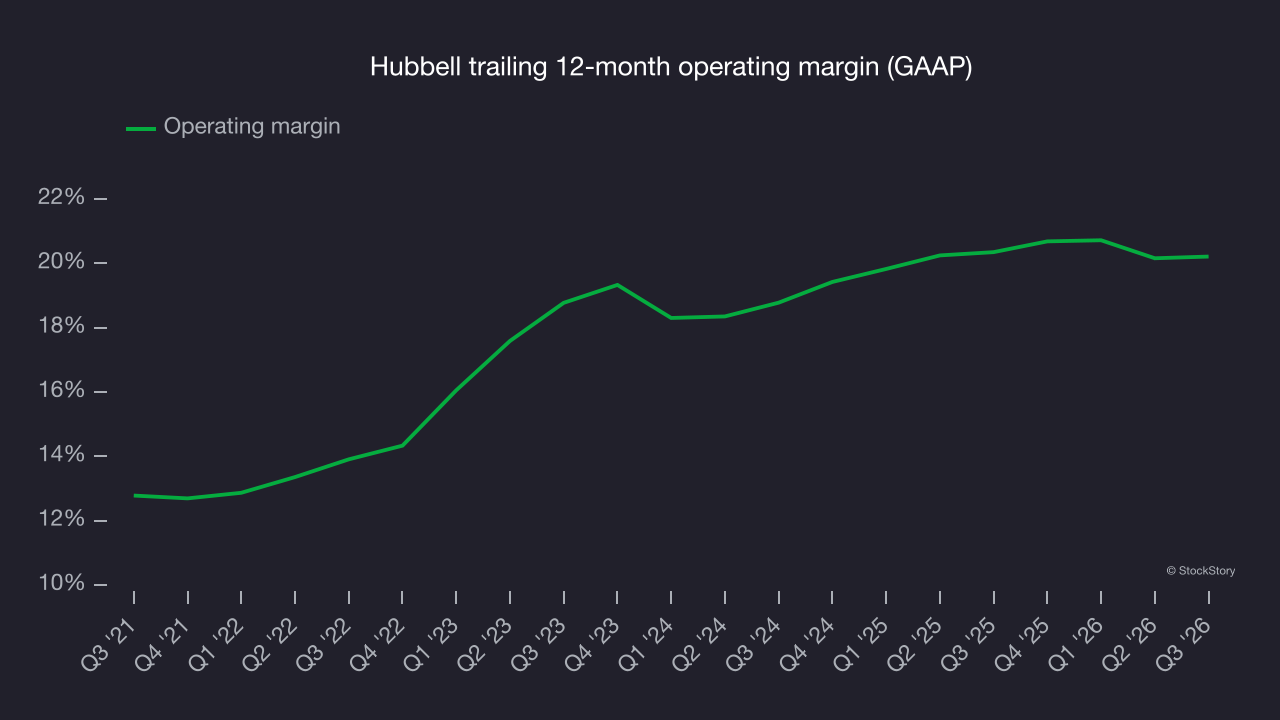
In Q3, Hubbell generated an operating margin of 21.8%, in line with the same quarter last year. This indicates the company’s cost structure has recently been stable.
Earnings per share
Revenue trends explain a company’s historical growth, but the long-term change in earnings per share (EPS) points to the profitability of that growth. For example, a company could inflate its revenue through excessive spending on advertising and promotions.
Hubbell’s EPS grew at a 20% compounded annual growth rate over the last five years, higher than its 10.5% annualized revenue growth. This tells us the company became more profitable on a per-share basis as it expanded.
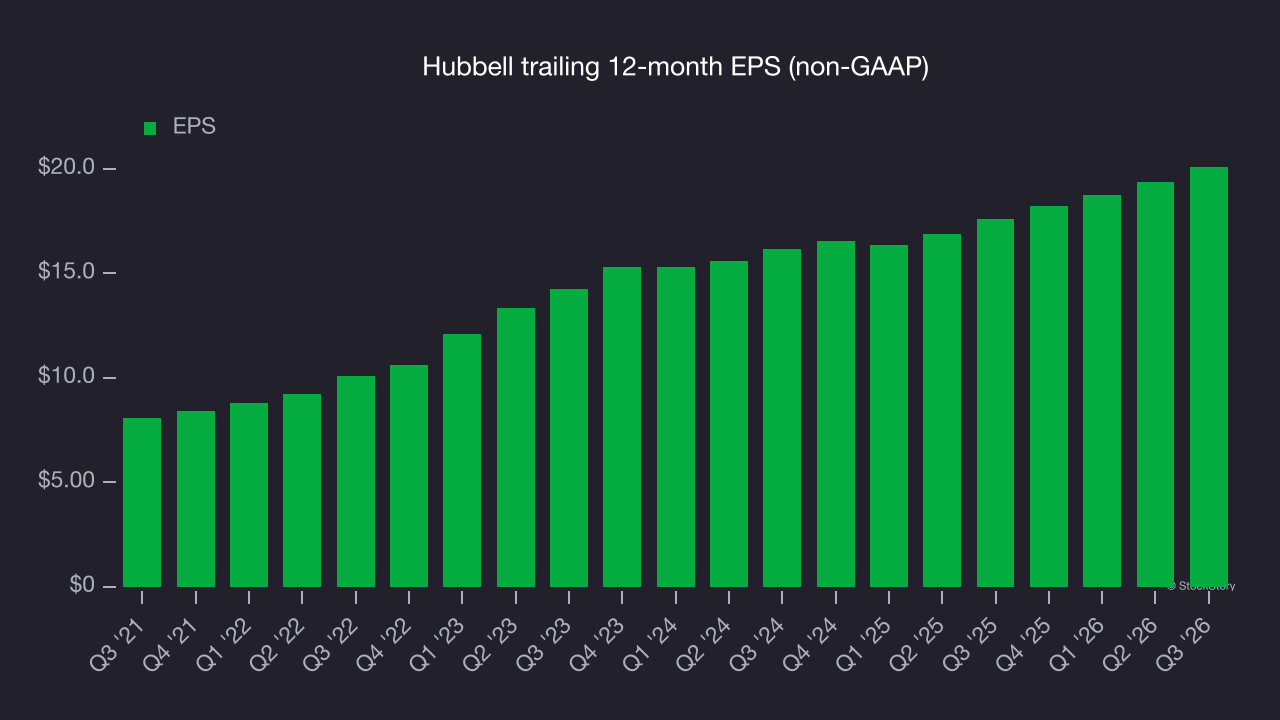
We can take a deeper look into Hubbell’s earnings quality to better understand the drivers of its performance. As we mentioned earlier, Hubbell’s operating margin was flat this quarter but expanded by 6.3 percentage points over the last five years. On top of that, its share count shrank by 2.9%. These are positive signs for shareholders because improving profitability and share buybacks boost EPS growth relative to revenue growth. 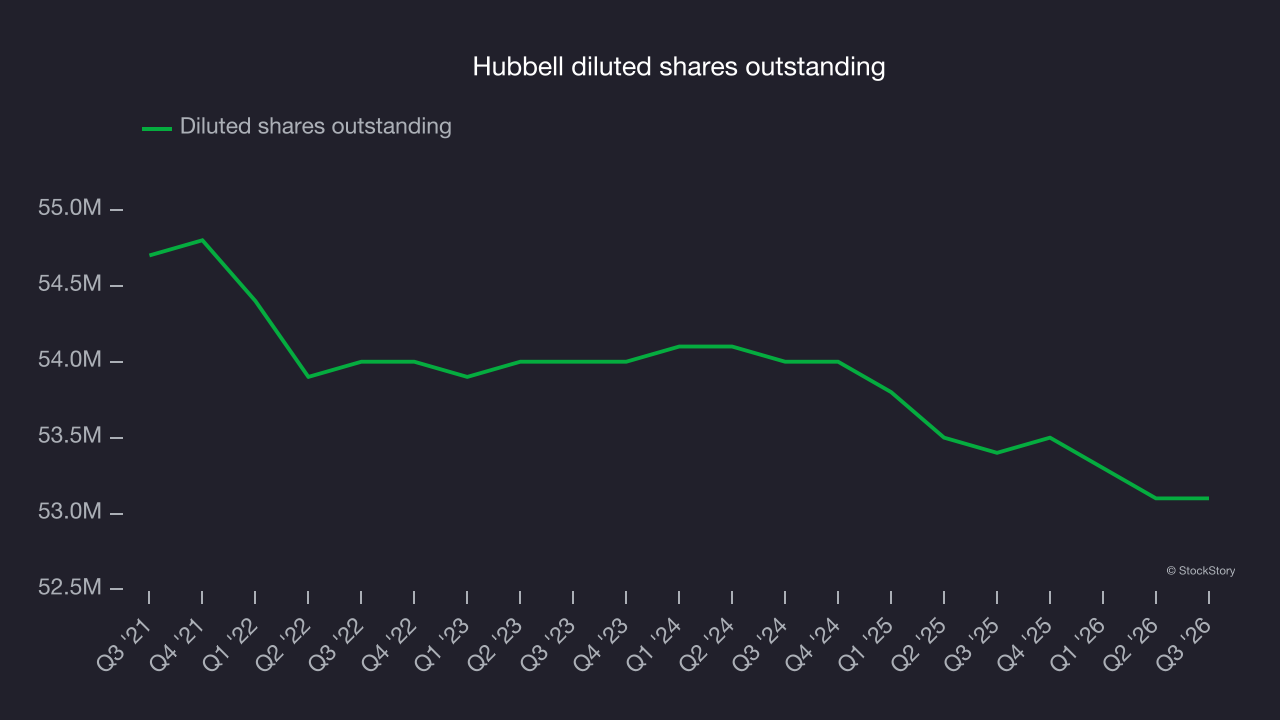
Like with revenue, we analyze EPS over a more recent period because it can provide insight into an emerging theme or development for the business.
For Hubbell, its two-year annual EPS growth of 11.5% was lower than its five-year trend. That was still a good growth rate.
In Q3, Hubbell reported adjusted EPS of $5.91, rising from $5.17 in the same quarter last year. This result beat analysts’ consensus estimates by 2.7%. Over the next 12 months, Wall Street expects Hubbell’s full-year EPS to grow 12% from $20.09 to $22.49, according to S&P.
Key takeaways from Hubbell’s Q3 results
Hubbell delivered a mixed quarter, with EBITDA above analysts’ consensus estimates and revenue just ahead of Wall Street’s consensus. Organic revenue, however, fell slightly short of expectations. Investors were likely hoping for more: shares tumbled 5% to $436.24 immediately after the results.
To evaluate Hubbell as an investment, consider its valuation, business quality and what happened in the latest quarter. For more, read the full research report here (it’s free).