Hotel franchising company Wyndham (NYSE: WH) fell short of the market’s revenue expectations in Q3 CY2025, with sales falling 3.5% year on year to $382 million. Its non-GAAP profit of $1.46 per share was 2% above analysts’ consensus estimates.
Is now the time to buy Wyndham? Find out by accessing our full research report, it’s free for active Edge members.
Wyndham (WH) Q3 CY2025 Highlights:
- Revenue: $382 million vs analyst estimates of $401 million (3.5% year-on-year decline, 4.7% miss)
- Adjusted EPS: $1.46 vs analyst estimates of $1.43 (2% beat)
- Adjusted EBITDA: $208 million vs analyst estimates of $210.6 million (54.5% margin, 1.2% miss)
- Management lowered its full-year Adjusted EPS guidance to $4.55 at the midpoint, a 3% decrease
- EBITDA guidance for the full year is $720 million at the midpoint, below analyst estimates of $734.9 million
- Operating Margin: 46.6%, up from 43.2% in the same quarter last year
- Free Cash Flow Margin: 25.4%, up from 17.9% in the same quarter last year
- RevPAR: $50.05 at quarter end, down 4.8% year on year
- Market Capitalization: $6.19 billion
Company Overview
Established in 1981, Wyndham (NYSE: WH) is a global hotel franchising company with over 9,000 hotels across nearly 95 countries on six continents.
Revenue Growth
A company’s long-term sales performance is one signal of its overall quality. Even a bad business can shine for one or two quarters, but a top-tier one grows for years. Unfortunately, Wyndham struggled to consistently increase demand as its $1.44 billion of sales for the trailing 12 months was close to its revenue five years ago. This was below our standards and suggests it’s a lower quality business.
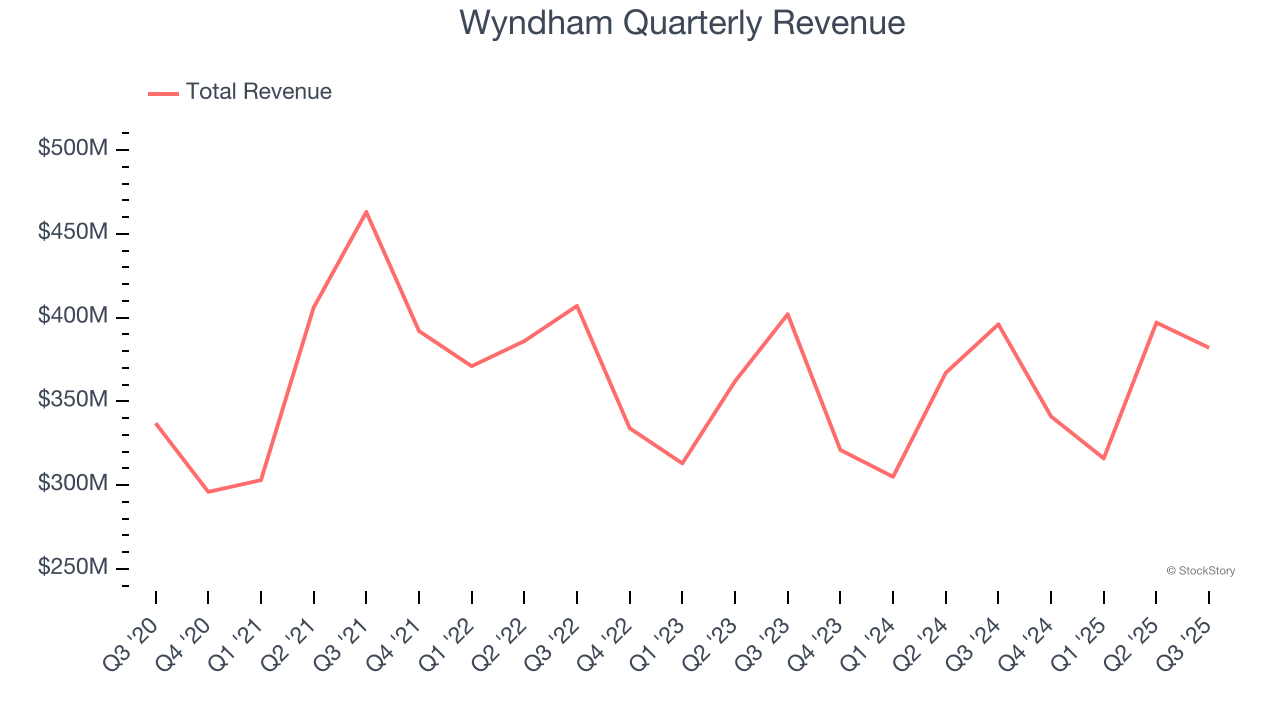
We at StockStory place the most emphasis on long-term growth, but within consumer discretionary, a stretched historical view may miss a company riding a successful new property or trend. Just like its five-year trend, Wyndham’s revenue over the last two years was flat, suggesting it is in a slump. 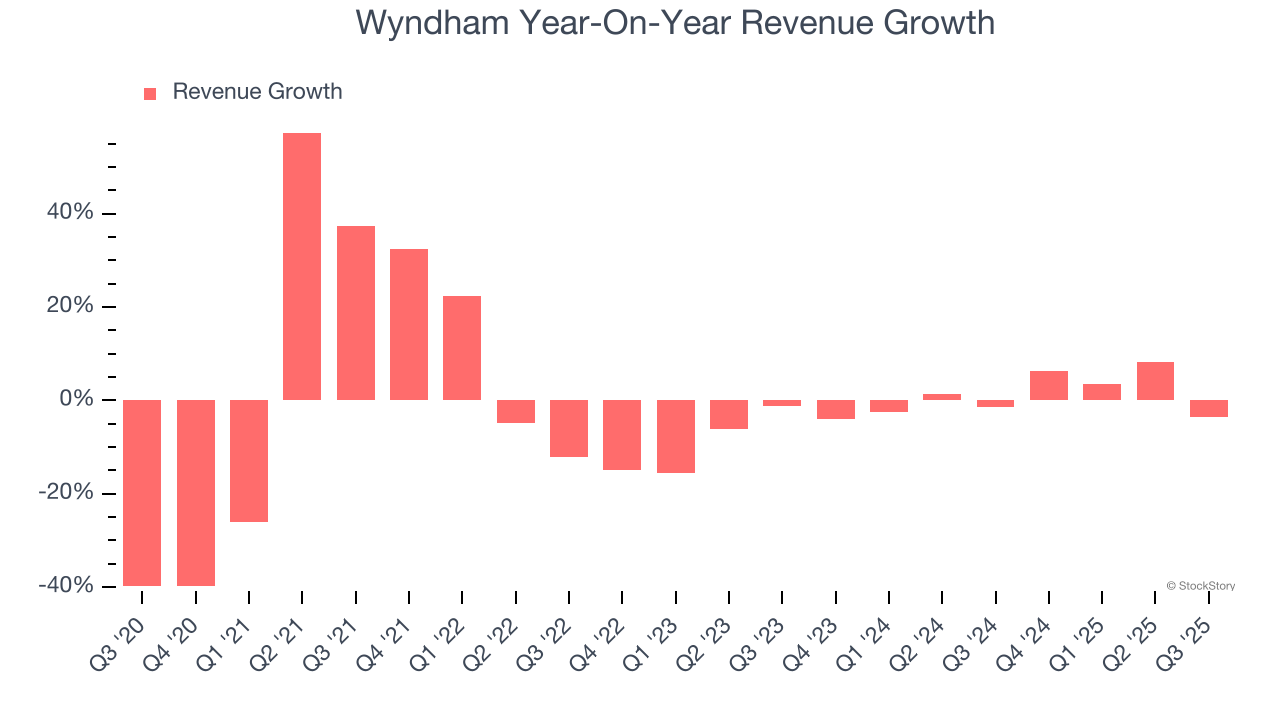
We can dig further into the company’s revenue dynamics by analyzing its revenue per available room, which clocked in at $50.05 this quarter and is a key metric accounting for daily rates and occupancy levels. Over the last two years, Wyndham’s revenue per room averaged 1.9% year-on-year growth. This number doesn’t surprise us as it’s in line with its revenue growth. 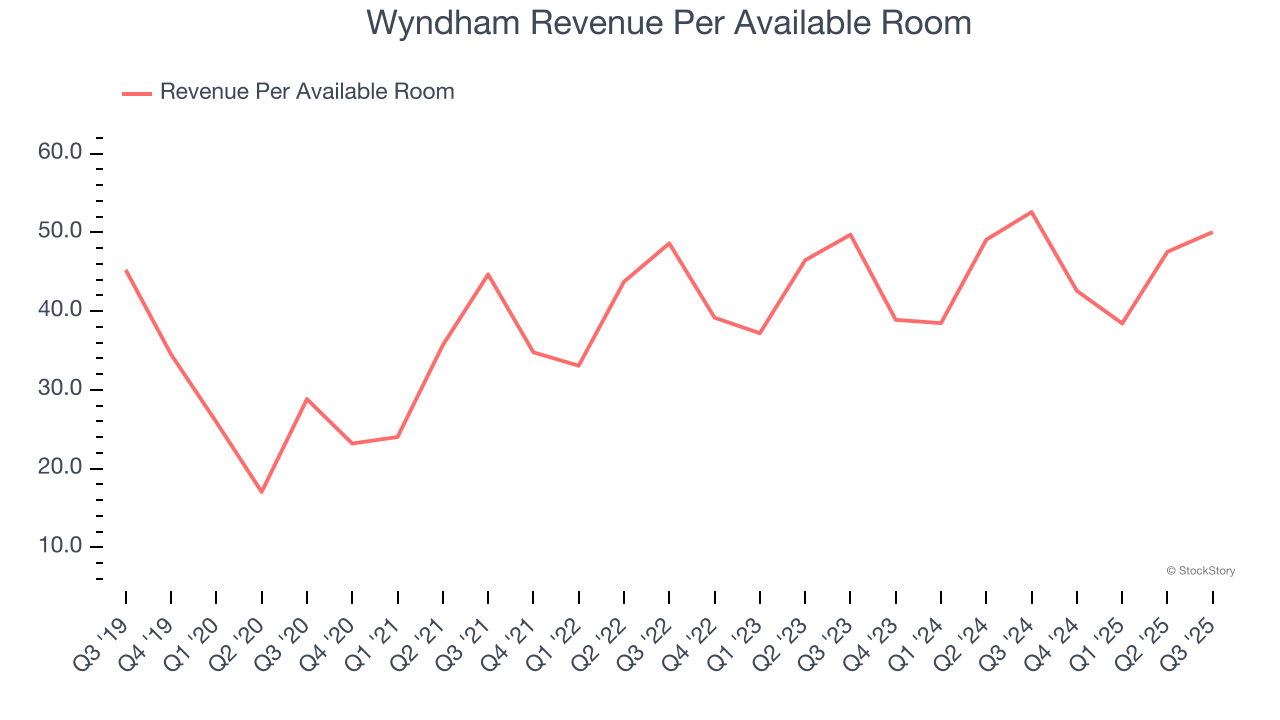
This quarter, Wyndham missed Wall Street’s estimates and reported a rather uninspiring 3.5% year-on-year revenue decline, generating $382 million of revenue.
Looking ahead, sell-side analysts expect revenue to grow 5.9% over the next 12 months. Although this projection implies its newer products and services will catalyze better top-line performance, it is still below the sector average.
Software is eating the world and there is virtually no industry left that has been untouched by it. That drives increasing demand for tools helping software developers do their jobs, whether it be monitoring critical cloud infrastructure, integrating audio and video functionality, or ensuring smooth content streaming. Click here to access a free report on our 3 favorite stocks to play this generational megatrend.
Operating Margin
Operating margin is a key measure of profitability. Think of it as net income - the bottom line - excluding the impact of taxes and interest on debt, which are less connected to business fundamentals.
Wyndham’s operating margin has been trending up over the last 12 months and averaged 36.8% over the last two years. On top of that, its profitability was elite for a consumer discretionary business thanks to its efficient cost structure and economies of scale.
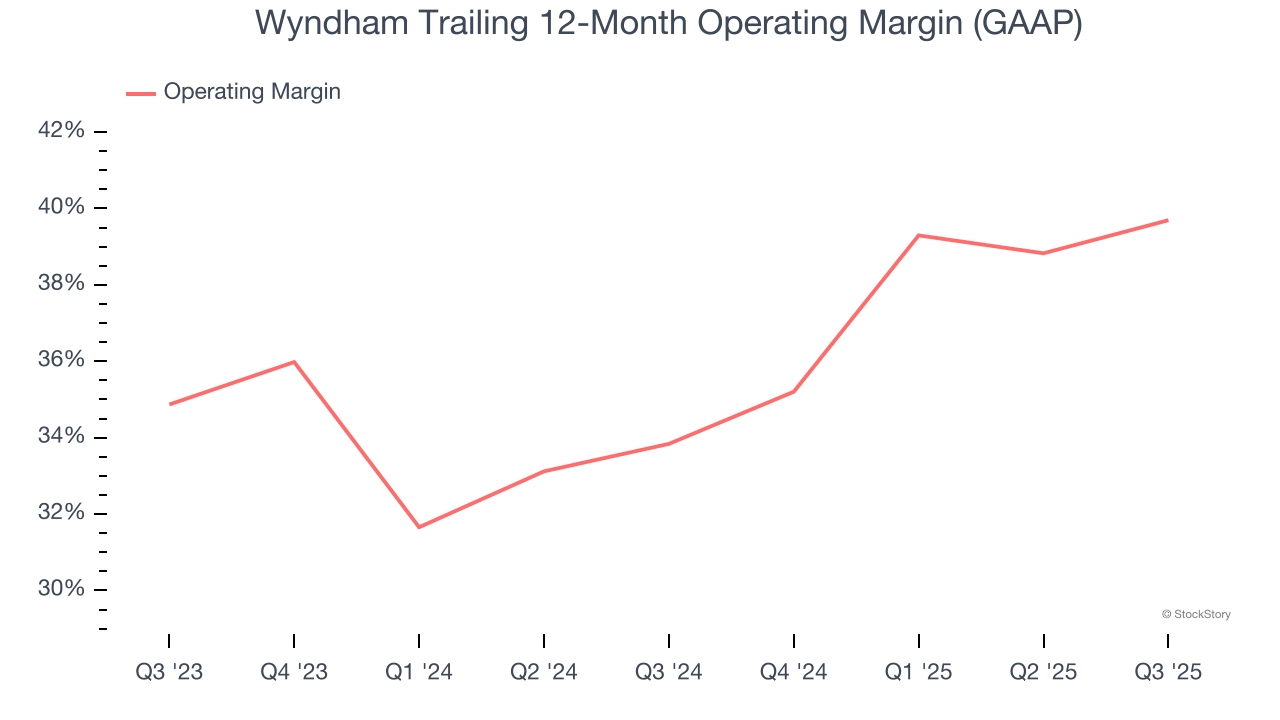
This quarter, Wyndham generated an operating margin profit margin of 46.6%, up 3.4 percentage points year on year. This increase was a welcome development, especially since its revenue fell, showing it was more efficient because it scaled down its expenses.
Earnings Per Share
We track the long-term change in earnings per share (EPS) for the same reason as long-term revenue growth. Compared to revenue, however, EPS highlights whether a company’s growth is profitable.
Wyndham’s EPS grew at a spectacular 21.5% compounded annual growth rate over the last five years, higher than its flat revenue. This tells us management responded to softer demand by adapting its cost structure.
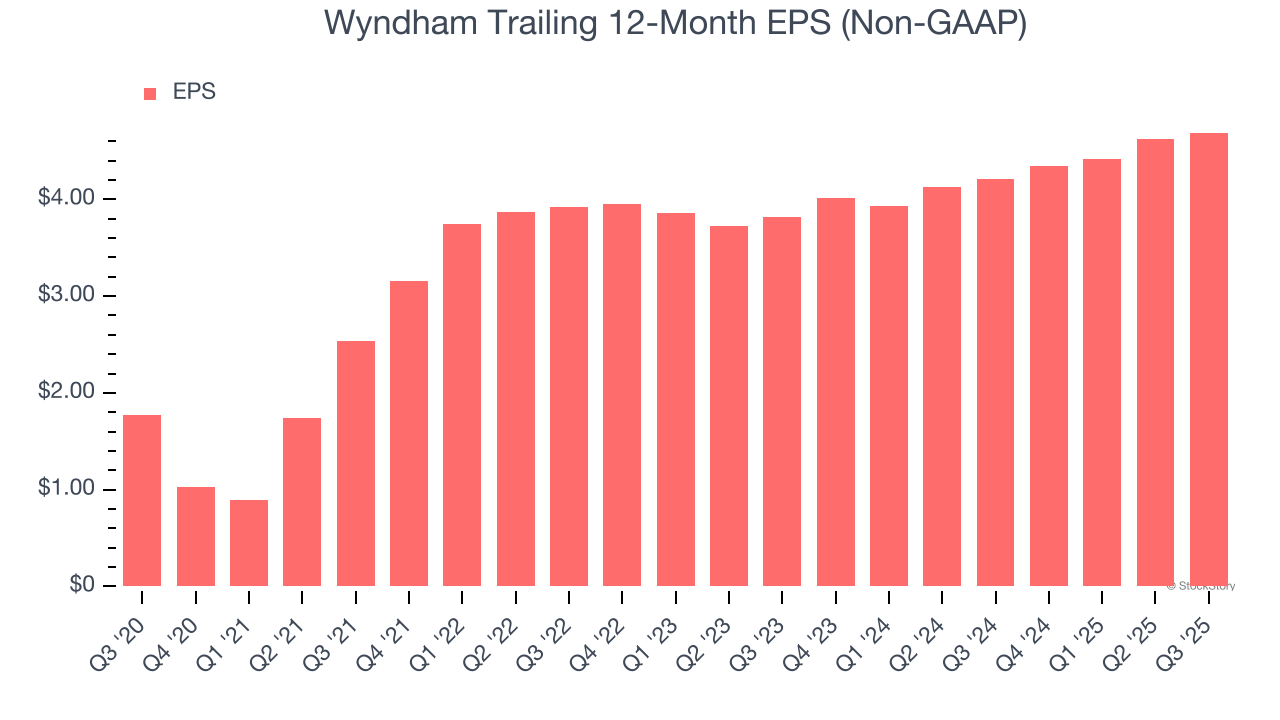
In Q3, Wyndham reported adjusted EPS of $1.46, up from $1.39 in the same quarter last year. This print beat analysts’ estimates by 2%. Over the next 12 months, Wall Street expects Wyndham’s full-year EPS of $4.69 to grow 9.3%.
Key Takeaways from Wyndham’s Q3 Results
We struggled to find many positives in these results. Its revenue missed and its full-year EBITDA guidance fell short of Wall Street’s estimates. Overall, this was a weaker quarter. The stock traded down 4.8% to $76.50 immediately after reporting.
Wyndham underperformed this quarter, but does that create an opportunity to invest right now? If you’re making that decision, you should consider the bigger picture of valuation, business qualities, as well as the latest earnings. We cover that in our actionable full research report which you can read here, it’s free for active Edge members.