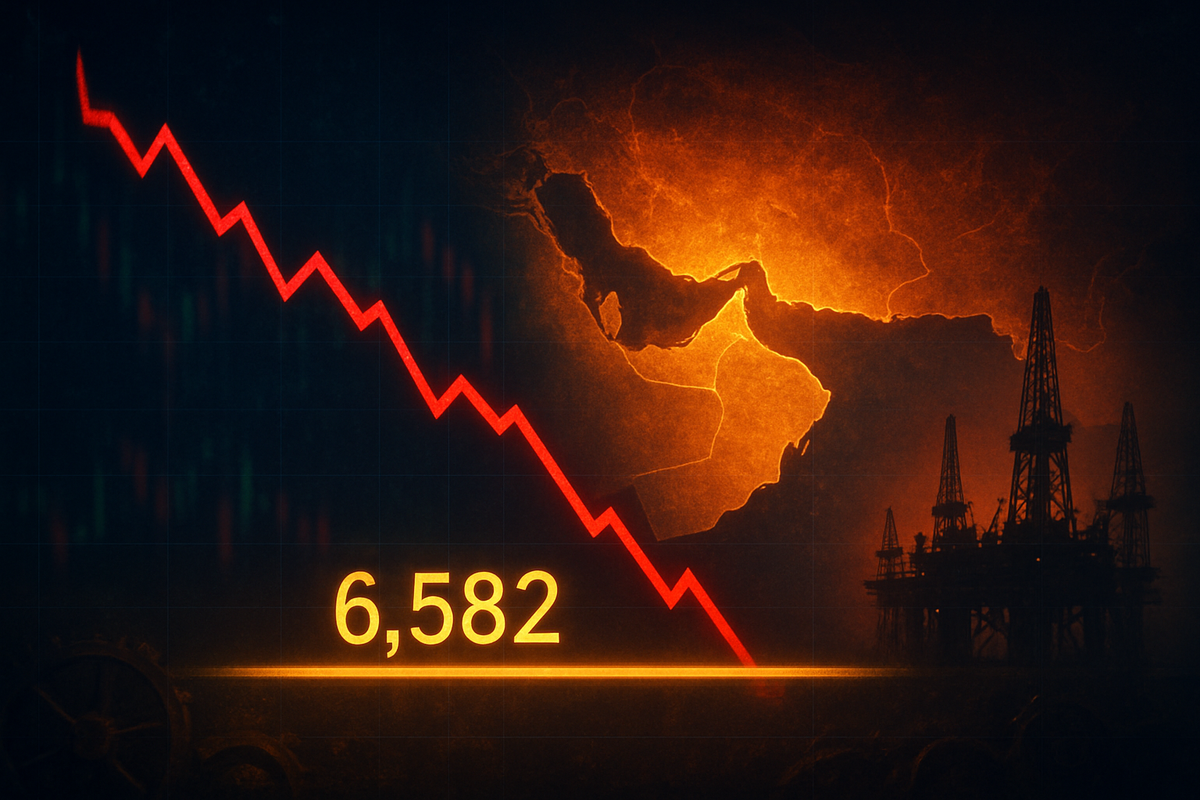
The global financial markets are bracing for a high-stakes technical showdown as the S&P 500 (NYSE Arca: SPY) continues its persistent slide toward a critical psychological and technical floor. As of March 12, 2026, the index is hovering near 6,740, but all eyes are fixed on the 200-day moving average at 6,582. This level, widely considered the "final line of defense" for the multi-year bull market that defined 2024 and 2025, is being tested by a toxic cocktail of geopolitical instability in the Middle East and a sudden, sharp cooling of the American labor market.
The immediate implications are stark: a breach below 6,582 could signal a formal transition from a "healthy correction" into a prolonged cyclical bear market. With Brent crude oil surging past $120 per barrel following the functional shutdown of the Strait of Hormuz, the specter of stagflation—stagnant growth coupled with high inflation—has returned to haunt Wall Street. Investors are now questioning whether the Federal Reserve has the tools to intervene, as the dual mandate of price stability and full employment is pulled in opposite directions by the "Iran Shock."
The Descent to 6,582: A Timeline of Technical Deterioration
The current market malaise began in late January 2026, shortly after the S&P 500 reached a record peak of 7,002. What initially appeared to be routine profit-taking quickly intensified as geopolitical tensions escalated. The primary catalyst, dubbed the "Iran Shock," saw a dramatic confrontation in the Persian Gulf, leading to a blockade of the Strait of Hormuz—a maritime artery responsible for one-fifth of the world’s oil supply. This event sent West Texas Intermediate (WTI) crude jumping from $67 to nearly $100 per barrel in a matter of weeks, while Brent crude breached the $120 mark.
The technical breakdown followed in rapid succession. By early March, the index decisively broke below its 100-day moving average at 6,830 and shattered a secondary support level at 6,764. The selling pressure was compounded by a disastrous February payrolls report, which revealed a loss of 92,000 jobs—a massive miss compared to the 70,000 gain economists had anticipated. This labor market contraction, the first of its kind in years, has sent the unemployment rate climbing to 4.4%, catching institutional players and passive investors alike off guard.
Market reaction has been characterized by a "slow-motion grind" lower rather than a panicked crash. This lack of a "capitulation spike" suggests that investors are still tentatively holding out hope that the 200-day moving average at 6,582 will provide a bounce. However, volume has been thin on up days, and volatility has remained stubbornly high, indicating that the institutional "smart money" is increasingly moving to the sidelines or hedging against further downside.
Winners and Losers in the Shadow of the Moving Average
In this environment of rising energy costs and economic uncertainty, the market's traditional leaders are being reshuffled. The most prominent "losers" in the current correction are the high-flying technology and AI sectors, which led the 2025 rally. Companies like Nvidia (NASDAQ: NVDA) and AMD (NASDAQ: AMD) have seen their valuations slashed by more than 30% from their peaks as "AI anxiety" takes hold. Investors are reassessing the multi-billion-dollar capital expenditure budgets of these firms in the face of a potential recession. Similarly, the transportation sector is under heavy fire; Delta Air Lines (NYSE: DAL) and United Airlines (NASDAQ: UAL) are struggling with the dual burden of skyrocketing jet fuel costs and cooling consumer demand for travel.
Conversely, the energy sector has emerged as a temporary safe haven. Giants like ExxonMobil (NYSE: XOM) and Chevron (NYSE: CVX) are reaping the benefits of the oil price spike, with their shares outperforming the broader market as they generate massive free cash flow. Defense contractors are also seeing increased interest due to the heightened geopolitical risk; Lockheed Martin (NYSE: LMT) and Northrop Grumman (NYSE: NOC) have remained resilient as the prospect of increased military spending looms large in the 2026 budget discussions.
Retail and consumer discretionary giants are also feeling the pinch. Amazon (NASDAQ: AMZN) is facing a "double whammy" of increased logistics and shipping costs due to fuel prices and a consumer base that is increasingly tightening its belt as the job market softens. If the S&P 500 fails to hold 6,582, these consumer-facing stocks could see further significant drawdowns as the reality of a "stagflationary" recession sets in.
Historical Precedents and the "Kiss of Death"
The significance of the 200-day moving average during an oil shock cannot be overstated, as historical precedents paint a cautionary tale. During the 1973 OPEC embargo and the 2008 oil price peak, the S&P 500’s descent below the 200-day MA served as a definitive warning. In 2008, as oil hit $147 a barrel, the index used the 200-day MA as "absolute resistance," where every rally was met with a wave of selling, leading eventually to the Global Financial Crisis.
Similarly, in 2022, following the Russia-Ukraine invasion, the 200-day MA acted as a "failed breakout point." The index famously rallied to touch the average in August 2022 before being violently rejected—a move technicians call the "kiss of death." This historical context suggests that if the index fails to reclaim 6,582 quickly after a breach, the level will likely flip from a safety net to a ceiling that could suppress market returns for the remainder of 2026.
This event fits into a broader trend of "de-globalization" and energy insecurity that has plagued the mid-2020s. The ripple effects extend beyond the stock market; a sustained period below this technical level could force a policy pivot from the Federal Reserve. However, unlike previous downturns, the Fed is in a "tricky spot." Cutting interest rates to support the crumbling labor market could reignite energy-driven inflation, leaving the central bank with no easy path forward and potentially leading to a period of "policy paralysis."
What Comes Next: Scenarios for 6,582
The short-term outlook depends heavily on whether the 200-day moving average at 6,582 holds on the first touch. A "bounce" from this level could provide a relief rally toward 6,700, offering a window for investors to de-risk. However, a decisive close below 6,582 would likely trigger a wave of algorithmic selling, as many quantitative funds use this level as a "stop-loss" for long positions. Under this scenario, the next psychological target is 6,500, with a major Fibonacci retracement level sitting at 6,515.
Longer-term, the market may require a strategic pivot. We could see a "lost year" for equities in 2026 as the economy digests the energy shock. Market opportunities may emerge in "old economy" stocks—value-oriented companies with strong balance sheets and low energy sensitivity—while the high-growth "AI darlings" of yesteryear may undergo a prolonged period of consolidation. The ultimate outcome hinges on the duration of the Strait of Hormuz crisis; a quick diplomatic resolution could see a "V-shaped" recovery similar to the 1991 Gulf War, while a prolonged blockade would almost certainly cement a bear market.
Wrap-Up: A Defining Moment for Investors
The S&P 500's approach to 6,582 is more than just a technical milestone; it is a referendum on the health of the global economy in 2026. The convergence of a geopolitical energy crisis and a deteriorating domestic labor market has placed the current bull market in its most precarious position in years. The key takeaway for investors is that the "buy the dip" mentality that worked so effectively in 2024 and 2025 is now being challenged by fundamental shifts in inflation and growth.
As we move forward, the 6,582 level will serve as the primary barometer for market sentiment. Investors should watch for "confirmation" of a breach—multiple daily closes below the average on rising volume—as a signal to increase defensive postures. While the energy sector provides a temporary hedge, the broader market's fate remains tied to the Federal Reserve’s ability to navigate the narrow path between recession and inflation. In the coming months, the resilience of the American consumer and the stability of global oil transit will be the true deciders of whether the 6,582 line holds or breaks.
This content is intended for informational purposes only and is not financial advice