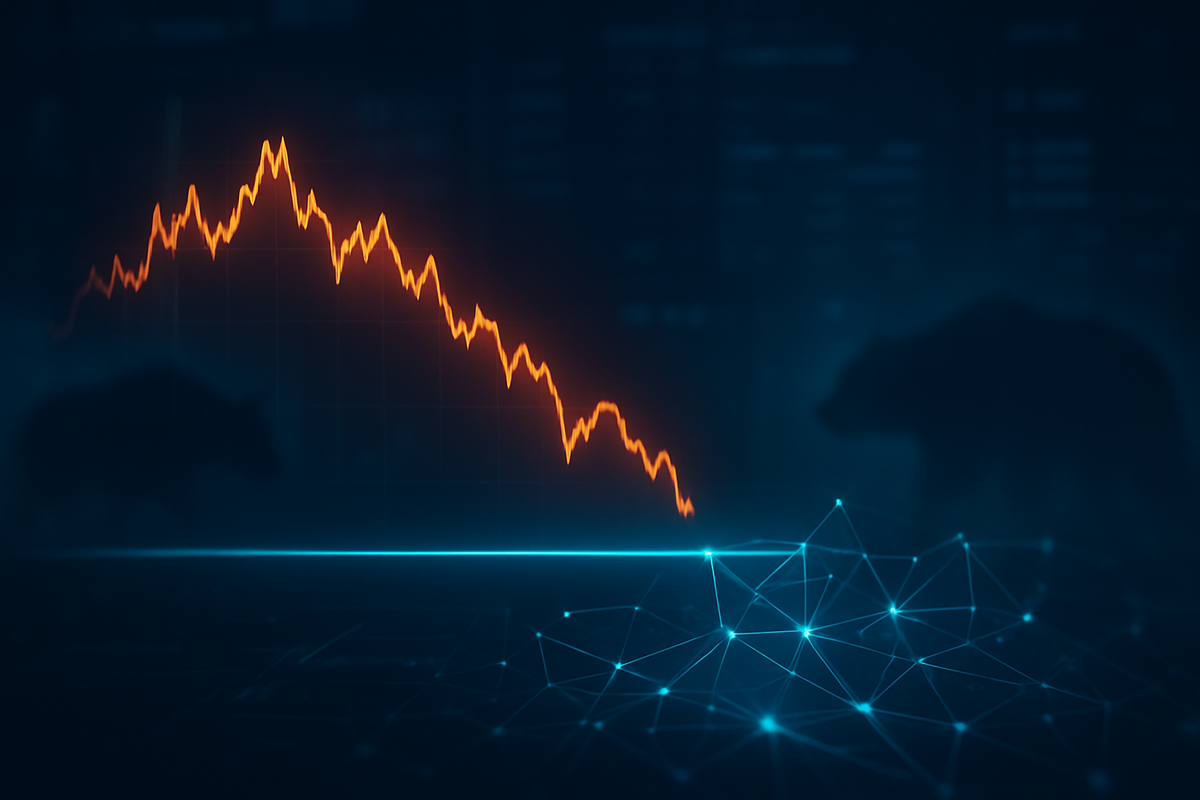
The S&P 500 (INDEXSP:.INX) entered the new year on a tenuous footing, grappling with a rare four-session losing streak that capped off an otherwise stellar 2025. After finishing the final trading day of the year at 6,845.50, the index is now facing its first major technical test of 2026. Market participants are closely watching key support levels as the "holiday fade" threatens to transition into a broader January correction, challenging the bullish momentum that defined much of the previous three years.
The immediate implications of this year-end slump are twofold: it has effectively neutralized the traditional "Santa Claus Rally" and forced a re-evaluation of short-term price targets. While the index posted a robust annual gain of approximately 16.5% in 2025, the late-December pullback—driven by profit-taking in high-flying artificial intelligence (AI) sectors and uncertainty surrounding new trade legislation—has left the market in a "choppy but bullish" state. Investors are now looking to the 50-day moving average as the primary line of defense to prevent a deeper slide toward psychological support levels.
A Decisive Shift in Year-End Momentum
The final week of 2025 defied historical norms, as the S&P 500 suffered four consecutive days of losses starting on December 26 and lasting through the final bell on December 31. This downturn was particularly notable because it occurred during a period typically characterized by light volume and upward bias. Instead, the index fell from a near-term peak above 6,930 to its year-end close, as institutional investors engaged in aggressive rebalancing. This "window dressing" saw many funds locking in gains from the year’s top performers to prepare for a 2026 landscape shaped by the "One Big Beautiful Bill Act" (OBBBA) and renewed tariff rhetoric.
The timeline of this decline was exacerbated by thin holiday liquidity, which allowed even modest selling pressure to move the needle significantly. Key players in this shift included large-scale institutional asset managers who moved to de-risk portfolios ahead of the January 20th presidential inauguration and the subsequent implementation of new fiscal policies. Initial market reactions were cautious, with the CBOE Volatility Index (VIX) creeping upward as traders hedged against the possibility that the year-end weakness might be a precursor to a "naughty" January.
Winners and Losers in the Great Rebalancing
The year-end rotation created a stark divide between the 2025 winners and those positioned for 2026. Nvidia (NASDAQ: NVDA), the undisputed champion of the AI era, became a primary source of funds for investors looking to lock in profits, dropping nearly 1.75% in the final sessions of the year. Similarly, Tesla (NASDAQ: TSLA) faced significant headwinds, falling 3.3% in the last week of December as concerns mounted over rising industrial metal prices and the potential rollback of EV tax credits under the OBBBA. Trade-sensitive stocks like The Trade Desk (NASDAQ: TTD) and Lululemon (NASDAQ: LULU) also faced heavy selling pressure as the market braced for a potential slowdown in discretionary spending.
Conversely, defensive stalwarts and infrastructure plays emerged as relative winners. Walmart (NYSE: WMT) and Costco (NASDAQ: COST) showed resilience, benefiting from a "trade-down" narrative as middle-income consumers adjusted to persistent inflationary pressures. In the tech space, Micron (NASDAQ: MU) managed to hold its ground, supported by news that its high-bandwidth memory capacity is already sold out through 2026. The real winners of the transition, however, appear to be the "AI Nervous System" companies—those providing the power and cooling for data centers. Vertiv Holdings (NYSE: VRT) and Arista Networks (NYSE: ANET) have seen sustained interest as the investment narrative shifts from GPUs to the physical infrastructure required to run them.
Wider Significance and Historical Precedents
The failure of the Santa Claus Rally—defined as the last five sessions of December and the first two of January—carries historical weight that technical analysts cannot ignore. According to the Stock Trader’s Almanac, when "Santa fails to call," it often signals a higher probability of a weak January and a more volatile year ahead. Historical precedents like 1999 and 2007 show that a negative holiday window can be a precursor to major market shifts, though more recent exceptions like 2024 prove that the "January Indicator Trifecta" is not an absolute destiny.
Beyond the charts, this event fits into a broader industry trend of "The Great Rebalancing." The market is moving away from a narrow focus on the "Magnificent Seven" and toward a more diversified growth model that includes nuclear energy providers like Constellation Energy (NASDAQ: CEG) and networking giants like Broadcom (NASDAQ: AVGO). This shift is partly driven by regulatory and policy implications from the OBBBA, which favors traditional and nuclear energy over intermittent renewables, creating a localized liquidity crunch for green tech while boosting the "AI power crunch" beneficiaries.
The Path Ahead for 2026
Looking forward, the S&P 500 faces a critical juncture. In the short term, the index is testing its 50-day moving average near 6,804.75. A successful bounce from this level could see the market renew its push toward the 7,000 psychological milestone. However, if this support fails, the next major "hard floor" is identified at 6,500, with the long-term 200-day moving average sitting much lower at 6,292.61. Strategic pivots will likely be required as investors move from pure growth plays into "quality value" sectors that can withstand potential tariff-induced supply chain disruptions.
The market opportunities in 2026 are expected to emerge in the "AI infrastructure" and "Healthcare" sectors. Companies like Eli Lilly (NYSE: LLY) continue to see robust demand, while the energy sector's evolution toward supporting edge data centers offers a new frontier for capital. Potential scenarios include a "flat" first half of the year as the market digests the new administration's policy rollouts, followed by a potential year-end rally if corporate earnings remain resilient in the face of higher-for-longer interest rates.
Market Wrap-Up and Investor Outlook
As the S&P 500 kicks off 2026, the key takeaway is one of cautious optimism tempered by technical reality. The year-end losing streak has cleared some of the "froth" from the market, but it has also raised the stakes for the first few weeks of January. Moving forward, the market's ability to hold the 6,800 level will be the most significant indicator of whether the current bull run has the stamina to reach new heights or if a period of consolidation is necessary.
Investors should watch for the completion of the "January Barometer"—the theory that the market's performance in January sets the tone for the entire year. Key metrics to monitor include the implementation of the OBBBA, shifts in nuclear energy regulation, and the sustainability of AI infrastructure spending. While the technical state of the S&P 500 is currently under pressure, the underlying fundamentals of corporate earnings and technological innovation remain the long-term drivers to watch.
This content is intended for informational purposes only and is not financial advice.