- Reported net income attributable to Valero stockholders of $714 million, or $2.28 per share
- Repaid the outstanding principal balance of $251 million of 2.85% Senior Notes that matured in April
- Declared a regular quarterly cash dividend on common stock of $1.13 per share on July 17
- Returned $695 million to stockholders through dividends and stock buybacks
Valero Energy Corporation (NYSE: VLO, “Valero”) today reported net income attributable to Valero stockholders of $714 million, or $2.28 per share, for the second quarter of 2025, compared to net income of $880 million, or $2.71 per share, for the second quarter of 2024.
Refining
The Refining segment reported operating income of $1.3 billion for the second quarter of 2025, compared to operating income of $1.2 billion for the second quarter of 2024. Refining throughput volumes averaged 2.9 million barrels per day in the second quarter of 2025.
“We delivered solid financial results for the second quarter, driven by our strong operational and commercial execution,” said Lane Riggs, Valero’s Chairman, Chief Executive Officer and President. “In fact, we set a record for refining throughput rate in our U.S. Gulf Coast region in the second quarter, demonstrating the benefits of our investments in growth and optimization projects.”
Renewable Diesel
The Renewable Diesel segment, which consists of the Diamond Green Diesel joint venture (DGD), reported an operating loss of $79 million for the second quarter of 2025, compared to operating income of $112 million for the second quarter of 2024. Segment sales volumes averaged 2.7 million gallons per day in the second quarter of 2025.
Ethanol
The Ethanol segment reported $54 million of operating income for the second quarter of 2025, compared to $105 million for the second quarter of 2024. Ethanol production volumes averaged 4.6 million gallons per day in the second quarter of 2025.
Corporate and Other
General and administrative expenses were $220 million in the second quarter of 2025, compared to $203 million in the second quarter of 2024. The effective tax rate for the second quarter of 2025 was 30 percent.
Investing and Financing Activities
Net cash provided by operating activities was $936 million in the second quarter of 2025. Included in this amount was a $325 million unfavorable impact from working capital and $86 million of adjusted net cash used in operating activities associated with the other joint venture member’s share of DGD. Excluding these items, adjusted net cash provided by operating activities was $1.3 billion in the second quarter of 2025.
Capital investments totaled $407 million in the second quarter of 2025, of which $371 million was for sustaining the business, including costs for turnarounds, catalysts and regulatory compliance. Excluding capital investments attributable to the other joint venture member’s share of DGD and other variable interest entities, capital investments attributable to Valero were $399 million in the second quarter of 2025.
Valero returned $695 million to stockholders in the second quarter of 2025, of which $354 million was paid as dividends and $341 million was for the purchase of approximately 2.6 million shares of common stock, resulting in a payout ratio of 52 percent of adjusted net cash provided by operating activities.
On July 17, Valero announced a quarterly cash dividend on common stock of $1.13 per share, payable on September 2, 2025 to holders of record at the close of business on July 31, 2025.
“We remain committed to maintaining our track record of commercial and operational excellence, which has been a hallmark of Valero’s strategy for over a decade,” said Riggs. “Our commitment remains underpinned by a strong balance sheet that also provides us plenty of financial flexibility.”
Liquidity and Financial Position
Valero repaid the $251 million outstanding principal balance of its 2.85% Senior Notes that matured in April, ending the second quarter of 2025 with $8.4 billion of total debt, $2.3 billion of total finance lease obligations, and $4.5 billion of cash and cash equivalents. The debt to capitalization ratio, net of cash and cash equivalents, was 19 percent as of June 30, 2025.
Strategic Update
Valero is progressing with an FCC Unit optimization project at the St. Charles Refinery that will enable the refinery to increase the yield of high value products. The project is estimated to cost $230 million and is expected to be completed in 2026.
Conference Call
Valero’s senior management will hold a conference call at 10 a.m. ET today to discuss this earnings release and to provide an update on operations and strategy.
About Valero
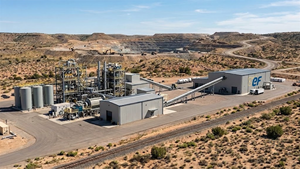
Valero Energy Corporation, through its subsidiaries (collectively, Valero), is a multinational manufacturer and marketer of petroleum-based and low-carbon liquid transportation fuels and petrochemical products, and sells its products primarily in the United States (U.S.), Canada, the United Kingdom (U.K.), Ireland and Latin America. Valero owns 15 petroleum refineries located in the U.S., Canada and the U.K. with a combined throughput capacity of approximately 3.2 million barrels per day. Valero is a joint venture member in Diamond Green Diesel Holdings LLC, which produces low-carbon fuels including renewable diesel and sustainable aviation fuel (SAF), with a production capacity of approximately 1.2 billion gallons per year in the U.S. Gulf Coast region. See the annual report on Form 10-K for more information on SAF. Valero also owns 12 ethanol plants located in the U.S. Mid-Continent region with a combined production capacity of approximately 1.7 billion gallons per year. Valero manages its operations through its Refining, Renewable Diesel, and Ethanol segments. Please visit investorvalero.com for more information.
Valero Contacts
Investors:
Homer Bhullar, Vice President – Investor Relations and Finance, 210-345-1982
Eric Herbort, Director – Investor Relations and Finance, 210-345-3331
Gautam Srivastava, Director – Investor Relations, 210-345-3992
Media:
Lillian Riojas, Executive Director – Media Relations and Communications, 210-345-5002
Safe-Harbor Statement
Statements contained in this release and the accompanying earnings release tables, or made during the conference call, that state Valero’s or management’s expectations or predictions of the future are forward-looking statements intended to be covered by the safe harbor provisions of the Securities Act of 1933 and the Securities Exchange Act of 1934. The words “believe,” “expect,” “should,” “estimates,” “intend,” “target,” “commitment,” “plans,” “forecast, “guidance” and other similar expressions identify forward-looking statements. Forward-looking statements in this release and the accompanying earnings release tables include, and those made on the conference call may include, statements relating to Valero’s low-carbon fuels strategy, expected timing, cost and performance of projects, our plans, actions, assets and operations in California and expected timing and cost of obligations and other financial statement impacts, future market and industry conditions, future operating and financial performance, future production and manufacturing ability and size, and management of future risks, among other matters. It is important to note that actual results could differ materially from those projected in such forward-looking statements based on numerous factors, including those outside of Valero’s control, such as legislative or political changes or developments, market dynamics, cyberattacks, weather events, and other matters affecting Valero’s operations and financial performance or the demand for Valero’s products. These factors also include, but are not limited to, the uncertainties that remain with respect to current or contemplated legal, political or regulatory developments that are adverse to or restrict refining and marketing operations, or that impose taxes or penalties on profits, windfalls, or margins above a certain level, tariffs and their effects on trading relationships, global geopolitical and other conflicts and tensions, the impact of inflation on margins and costs, economic activity levels, and the adverse effects the foregoing may have on Valero’s business plan, strategy, operations and financial performance. For more information concerning these and other factors that could cause actual results to differ from those expressed or forecasted, see Valero’s annual report on Form 10-K, quarterly reports on Form 10‑Q, and other reports filed with the Securities and Exchange Commission and available on Valero’s website at www.valero.com.
Use of Non-GAAP Financial Information
This earnings release and the accompanying earnings release tables include references to financial measures that are not defined under U.S. generally accepted accounting principles (GAAP). These non-GAAP measures include adjusted net income attributable to Valero stockholders, adjusted earnings per common share – assuming dilution, Refining margin, Renewable Diesel margin, Ethanol margin, adjusted Refining operating income, adjusted Ethanol operating income, adjusted net cash provided by operating activities, and capital investments attributable to Valero. These non-GAAP financial measures have been included to help facilitate the comparison of operating results between periods. See the accompanying earnings release tables for a definition of non-GAAP measures and a reconciliation to their most directly comparable GAAP measures. Note (e) to the earnings release tables provides reasons for the use of these non-GAAP financial measures.
VALERO ENERGY CORPORATION |
|||||||||||||||
EARNINGS RELEASE TABLES |
|||||||||||||||
FINANCIAL HIGHLIGHTS |
|||||||||||||||
(millions of dollars, except per share amounts) |
|||||||||||||||
(unaudited) |
|||||||||||||||
|
Three Months Ended June 30, |
|
Six Months Ended June 30, |
||||||||||||
|
|
2025 |
|
|
|
2024 |
|
|
|
2025 |
|
|
|
2024 |
|
Statement of income data |
|
|
|
|
|
|
|
||||||||
Revenues |
$ |
29,889 |
|
|
$ |
34,490 |
|
|
$ |
60,147 |
|
|
$ |
66,249 |
|
Cost of sales: |
|
|
|
|
|
|
|
||||||||
Cost of materials and other |
|
26,332 |
|
|
|
30,943 |
|
|
|
53,880 |
|
|
|
58,625 |
|
Operating expenses (excluding depreciation and amortization expense reflected below) |
|
1,522 |
|
|
|
1,424 |
|
|
|
3,045 |
|
|
|
2,835 |
|
Depreciation and amortization expense |
|
786 |
|
|
|
684 |
|
|
|
1,466 |
|
|
|
1,367 |
|
Total cost of sales |
|
28,640 |
|
|
|
33,051 |
|
|
|
58,391 |
|
|
|
62,827 |
|
Asset impairment loss (a) |
|
— |
|
|
|
— |
|
|
|
1,131 |
|
|
|
— |
|
Other operating expenses (b) |
|
4 |
|
|
|
3 |
|
|
|
8 |
|
|
|
37 |
|
General and administrative expenses (excluding depreciation and amortization expense reflected below) |
|
220 |
|
|
|
203 |
|
|
|
481 |
|
|
|
461 |
|
Depreciation and amortization expense |
|
28 |
|
|
|
12 |
|
|
|
39 |
|
|
|
24 |
|
Operating income |
|
997 |
|
|
|
1,221 |
|
|
|
97 |
|
|
|
2,900 |
|
Other income, net |
|
86 |
|
|
|
122 |
|
|
|
206 |
|
|
|
266 |
|
Interest and debt expense, net of capitalized interest |
|
(141 |
) |
|
|
(140 |
) |
|
|
(278 |
) |
|
|
(280 |
) |
Income before income tax expense |
|
942 |
|
|
|
1,203 |
|
|
|
25 |
|
|
|
2,886 |
|
Income tax expense |
|
279 |
|
|
|
277 |
|
|
|
14 |
|
|
|
630 |
|
Net income |
|
663 |
|
|
|
926 |
|
|
|
11 |
|
|
|
2,256 |
|
Less: Net income (loss) attributable to noncontrolling interests |
|
(51 |
) |
|
|
46 |
|
|
|
(108 |
) |
|
|
131 |
|
Net income attributable to Valero Energy Corporation stockholders |
$ |
714 |
|
|
$ |
880 |
|
|
$ |
119 |
|
|
$ |
2,125 |
|
|
|
|
|
|
|
|
|
||||||||
Earnings per common share |
$ |
2.28 |
|
|
$ |
2.71 |
|
|
$ |
0.37 |
|
|
$ |
6.47 |
|
Weighted-average common shares outstanding (in millions) |
|
312 |
|
|
|
324 |
|
|
|
313 |
|
|
|
327 |
|
|
|
|
|
|
|
|
|
||||||||
Earnings per common share – assuming dilution |
$ |
2.28 |
|
|
$ |
2.71 |
|
|
$ |
0.37 |
|
|
$ |
6.47 |
|
Weighted-average common shares outstanding – assuming dilution (in millions) |
|
312 |
|
|
|
324 |
|
|
|
313 |
|
|
|
327 |
|
See Notes to Earnings Release Tables. |
|||||||||||||||
VALERO ENERGY CORPORATION |
|||||||||||||||||
EARNINGS RELEASE TABLES |
|||||||||||||||||
FINANCIAL HIGHLIGHTS BY SEGMENT |
|||||||||||||||||
(millions of dollars) |
|||||||||||||||||
(unaudited) |
|||||||||||||||||
|
Refining |
|
Renewable Diesel |
|
Ethanol |
|
Corporate and Eliminations |
|
Total |
||||||||
Three months ended June 30, 2025 |
|
|
|
|
|
|
|
|
|
||||||||
Revenues: |
|
|
|
|
|
|
|
|
|
||||||||
Revenues from external customers |
$ |
28,324 |
|
$ |
565 |
|
|
$ |
1,000 |
|
|
$ |
— |
|
|
$ |
29,889 |
Intersegment revenues |
|
2 |
|
|
533 |
|
|
|
205 |
|
|
|
(740 |
) |
|
|
— |
Total revenues |
|
28,326 |
|
|
1,098 |
|
|
|
1,205 |
|
|
|
(740 |
) |
|
|
29,889 |
Cost of sales: |
|
|
|
|
|
|
|
|
|
||||||||
Cost of materials and other |
|
25,042 |
|
|
1,044 |
|
|
|
988 |
|
|
|
(742 |
) |
|
|
26,332 |
Operating expenses (excluding depreciation and amortization expense reflected below) |
|
1,307 |
|
|
72 |
|
|
|
144 |
|
|
|
(1 |
) |
|
|
1,522 |
Depreciation and amortization expense |
|
707 |
|
|
61 |
|
|
|
19 |
|
|
|
(1 |
) |
|
|
786 |
Total cost of sales |
|
27,056 |
|
|
1,177 |
|
|
|
1,151 |
|
|
|
(744 |
) |
|
|
28,640 |
Other operating expenses |
|
4 |
|
|
— |
|
|
|
— |
|
|
|
— |
|
|
|
4 |
General and administrative expenses (excluding depreciation and amortization expense reflected below) |
|
— |
|
|
— |
|
|
|
— |
|
|
|
220 |
|
|
|
220 |
Depreciation and amortization expense |
|
— |
|
|
— |
|
|
|
— |
|
|
|
28 |
|
|
|
28 |
Operating income (loss) by segment |
$ |
1,266 |
|
$ |
(79 |
) |
|
$ |
54 |
|
|
$ |
(244 |
) |
|
$ |
997 |
|
|
|
|
|
|
|
|
|
|
||||||||
Three months ended June 30, 2024 |
|
|
|
|
|
|
|
|
|
||||||||
Revenues: |
|
|
|
|
|
|
|
|
|
||||||||
Revenues from external customers |
$ |
33,044 |
|
$ |
554 |
|
|
$ |
892 |
|
|
$ |
— |
|
|
$ |
34,490 |
Intersegment revenues |
|
3 |
|
|
630 |
|
|
|
229 |
|
|
|
(862 |
) |
|
|
— |
Total revenues |
|
33,047 |
|
|
1,184 |
|
|
|
1,121 |
|
|
|
(862 |
) |
|
|
34,490 |
Cost of sales: |
|
|
|
|
|
|
|
|
|
||||||||
Cost of materials and other |
|
29,995 |
|
|
930 |
|
|
|
874 |
|
|
|
(856 |
) |
|
|
30,943 |
Operating expenses (excluding depreciation and amortization expense reflected below) |
|
1,219 |
|
|
80 |
|
|
|
125 |
|
|
|
— |
|
|
|
1,424 |
Depreciation and amortization expense |
|
604 |
|
|
62 |
|
|
|
19 |
|
|
|
(1 |
) |
|
|
684 |
Total cost of sales |
|
31,818 |
|
|
1,072 |
|
|
|
1,018 |
|
|
|
(857 |
) |
|
|
33,051 |
Other operating expenses |
|
5 |
|
|
— |
|
|
|
(2 |
) |
|
|
— |
|
|
|
3 |
General and administrative expenses (excluding depreciation and amortization expense reflected below) |
|
— |
|
|
— |
|
|
|
— |
|
|
|
203 |
|
|
|
203 |
Depreciation and amortization expense |
|
— |
|
|
— |
|
|
|
— |
|
|
|
12 |
|
|
|
12 |
Operating income by segment |
$ |
1,224 |
|
$ |
112 |
|
|
$ |
105 |
|
|
$ |
(220 |
) |
|
$ |
1,221 |
See Operating Highlights by Segment. |
|||||||||||||||||
VALERO ENERGY CORPORATION |
||||||||||||||||
EARNINGS RELEASE TABLES |
||||||||||||||||
FINANCIAL HIGHLIGHTS BY SEGMENT |
||||||||||||||||
(millions of dollars) |
||||||||||||||||
(unaudited) |
||||||||||||||||
|
Refining |
|
Renewable Diesel |
|
Ethanol |
|
Corporate and Eliminations |
|
Total |
|||||||
Six months ended June 30, 2025 |
|
|
|
|
|
|
|
|
|
|||||||
Revenues: |
|
|
|
|
|
|
|
|
|
|||||||
Revenues from external customers |
$ |
57,081 |
|
$ |
1,058 |
|
|
$ |
2,008 |
|
$ |
— |
|
|
$ |
60,147 |
Intersegment revenues |
|
4 |
|
|
940 |
|
|
|
422 |
|
|
(1,366 |
) |
|
|
— |
Total revenues |
|
57,085 |
|
|
1,998 |
|
|
|
2,430 |
|
|
(1,366 |
) |
|
|
60,147 |
Cost of sales: |
|
|
|
|
|
|
|
|
|
|||||||
Cost of materials and other |
|
51,311 |
|
|
1,939 |
|
|
|
2,020 |
|
|
(1,390 |
) |
|
|
53,880 |
Operating expenses (excluding depreciation and amortization expense reflected below) |
|
2,598 |
|
|
150 |
|
|
|
298 |
|
|
(1 |
) |
|
|
3,045 |
Depreciation and amortization expense |
|
1,301 |
|
|
129 |
|
|
|
38 |
|
|
(2 |
) |
|
|
1,466 |
Total cost of sales |
|
55,210 |
|
|
2,218 |
|
|
|
2,356 |
|
|
(1,393 |
) |
|
|
58,391 |
Asset impairment loss (a) |
|
1,131 |
|
|
— |
|
|
|
— |
|
|
— |
|
|
|
1,131 |
Other operating expenses |
|
8 |
|
|
— |
|
|
|
— |
|
|
— |
|
|
|
8 |
General and administrative expenses (excluding depreciation and amortization expense reflected below) |
|
— |
|
|
— |
|
|
|
— |
|
|
481 |
|
|
|
481 |
Depreciation and amortization expense |
|
— |
|
|
— |
|
|
|
— |
|
|
39 |
|
|
|
39 |
Operating income (loss) by segment |
$ |
736 |
|
$ |
(220 |
) |
|
$ |
74 |
|
$ |
(493 |
) |
|
$ |
97 |
|
|
|
|
|
|
|
|
|
|
|||||||
Six months ended June 30, 2024 |
|
|
|
|
|
|
|
|
|
|||||||
Revenues: |
|
|
|
|
|
|
|
|
|
|||||||
Revenues from external customers |
$ |
63,187 |
|
$ |
1,256 |
|
|
$ |
1,806 |
|
$ |
— |
|
|
$ |
66,249 |
Intersegment revenues |
|
5 |
|
|
1,339 |
|
|
|
419 |
|
|
(1,763 |
) |
|
|
— |
Total revenues |
|
63,192 |
|
|
2,595 |
|
|
|
2,225 |
|
|
(1,763 |
) |
|
|
66,249 |
Cost of sales: |
|
|
|
|
|
|
|
|
|
|||||||
Cost of materials and other |
|
56,606 |
|
|
1,996 |
|
|
|
1,783 |
|
|
(1,760 |
) |
|
|
58,625 |
Operating expenses (excluding depreciation and amortization expense reflected below) |
|
2,403 |
|
|
170 |
|
|
|
262 |
|
|
— |
|
|
|
2,835 |
Depreciation and amortization expense |
|
1,204 |
|
|
127 |
|
|
|
38 |
|
|
(2 |
) |
|
|
1,367 |
Total cost of sales |
|
60,213 |
|
|
2,293 |
|
|
|
2,083 |
|
|
(1,762 |
) |
|
|
62,827 |
Other operating expenses (b) |
|
10 |
|
|
— |
|
|
|
27 |
|
|
— |
|
|
|
37 |
General and administrative expenses (excluding depreciation and amortization expense reflected below) |
|
— |
|
|
— |
|
|
|
— |
|
|
461 |
|
|
|
461 |
Depreciation and amortization expense |
|
— |
|
|
— |
|
|
|
— |
|
|
24 |
|
|
|
24 |
Operating income by segment |
$ |
2,969 |
|
$ |
302 |
|
|
$ |
115 |
|
$ |
(486 |
) |
|
$ |
2,900 |
See Operating Highlights by Segment. |
||||||||||||||||
See Notes to Earnings Release Tables. |
||||||||||||||||
VALERO ENERGY CORPORATION |
|||||||||||||
EARNINGS RELEASE TABLES |
|||||||||||||
RECONCILIATION OF NON-GAAP MEASURES TO MOST COMPARABLE AMOUNTS |
|||||||||||||
REPORTED UNDER U.S. GAAP (h) |
|||||||||||||
(millions of dollars) |
|||||||||||||
(unaudited) |
|||||||||||||
|
Three Months Ended June 30, |
|
Six Months Ended June 30, |
||||||||||
|
|
2025 |
|
|
2024 |
|
|
2025 |
|
|
|
2024 |
|
Reconciliation of net income attributable to Valero Energy Corporation stockholders to adjusted net income attributable to Valero Energy Corporation stockholders |
|
|
|
|
|
|
|
||||||
Net income attributable to Valero Energy Corporation stockholders |
$ |
714 |
|
$ |
880 |
|
$ |
119 |
|
|
$ |
2,125 |
|
Adjustments: |
|
|
|
|
|
|
|
||||||
Asset impairment loss (a) |
|
— |
|
|
— |
|
|
1,131 |
|
|
|
— |
|
Income tax benefit related to asset impairment loss |
|
— |
|
|
— |
|
|
(254 |
) |
|
|
— |
|
Asset impairment loss, net of taxes |
|
— |
|
|
— |
|
|
877 |
|
|
|
— |
|
Project liability adjustment (b) |
|
— |
|
|
— |
|
|
— |
|
|
|
29 |
|
Income tax benefit related to project liability adjustment |
|
— |
|
|
— |
|
|
— |
|
|
|
(7 |
) |
Project liability adjustment, net of taxes |
|
— |
|
|
— |
|
|
— |
|
|
|
22 |
|
Second-generation biofuel tax credit (c) |
|
— |
|
|
7 |
|
|
— |
|
|
|
14 |
|
Total adjustments |
|
— |
|
|
7 |
|
|
877 |
|
|
|
36 |
|
Adjusted net income attributable to Valero Energy Corporation stockholders |
$ |
714 |
|
$ |
887 |
|
$ |
996 |
|
|
$ |
2,161 |
|
Reconciliation of earnings per common share – assuming dilution to adjusted earnings per common share – assuming dilution |
|
|
|
|
|
|
|
||||||
Earnings per common share – assuming dilution |
$ |
2.28 |
|
$ |
2.71 |
|
$ |
0.37 |
|
$ |
6.47 |
||
Adjustments: |
|
|
|
|
|
|
|
||||||
Asset impairment loss (a) |
|
— |
|
|
— |
|
|
2.80 |
|
|
— |
||
Project liability adjustment (b) |
|
— |
|
|
— |
|
|
— |
|
|
0.07 |
||
Second-generation biofuel tax credit (c) |
|
— |
|
|
0.02 |
|
|
— |
|
|
0.04 |
||
Total adjustments |
|
— |
|
|
0.02 |
|
|
2.80 |
|
|
0.11 |
||
Adjusted earnings per common share – assuming dilution |
$ |
2.28 |
|
$ |
2.73 |
|
$ |
3.17 |
|
$ |
6.58 |
||
See Notes to Earnings Release Tables. |
|||||||||||||
VALERO ENERGY CORPORATION |
||||||||||||||
EARNINGS RELEASE TABLES |
||||||||||||||
RECONCILIATION OF NON-GAAP MEASURES TO MOST COMPARABLE AMOUNTS |
||||||||||||||
REPORTED UNDER U.S. GAAP (e) |
||||||||||||||
(millions of dollars) |
||||||||||||||
(unaudited) |
||||||||||||||
|
Three Months Ended June 30, |
|
Six Months Ended June 30, |
|||||||||||
|
|
2025 |
|
|
|
2024 |
|
|
|
2025 |
|
|
|
2024 |
Reconciliation of operating income (loss) by segment to segment margin, and reconciliation of operating income by segment to adjusted operating income by segment |
|
|
|
|
|
|
|
|||||||
Refining segment |
|
|
|
|
|
|
|
|||||||
Refining operating income |
$ |
1,266 |
|
|
$ |
1,224 |
|
|
$ |
736 |
|
|
$ |
2,969 |
Adjustments: |
|
|
|
|
|
|
|
|||||||
Operating expenses (excluding depreciation and amortization expense reflected below) |
|
1,307 |
|
|
|
1,219 |
|
|
|
2,598 |
|
|
|
2,403 |
Depreciation and amortization expense |
|
707 |
|
|
|
604 |
|
|
|
1,301 |
|
|
|
1,204 |
Asset impairment loss (a) |
|
— |
|
|
|
— |
|
|
|
1,131 |
|
|
|
— |
Other operating expenses |
|
4 |
|
|
|
5 |
|
|
|
8 |
|
|
|
10 |
Refining margin |
$ |
3,284 |
|
|
$ |
3,052 |
|
|
$ |
5,774 |
|
|
$ |
6,586 |
|
|
|
|
|
|
|
|
|||||||
Refining operating income |
$ |
1,266 |
|
|
$ |
1,224 |
|
|
$ |
736 |
|
|
$ |
2,969 |
Adjustments: |
|
|
|
|
|
|
|
|||||||
Asset impairment loss (a) |
|
— |
|
|
|
— |
|
|
|
1,131 |
|
|
|
— |
Other operating expenses |
|
4 |
|
|
|
5 |
|
|
|
8 |
|
|
|
10 |
Adjusted Refining operating income |
$ |
1,270 |
|
|
$ |
1,229 |
|
|
$ |
1,875 |
|
|
$ |
2,979 |
|
|
|
|
|
|
|
|
|||||||
Renewable Diesel segment |
|
|
|
|
|
|
|
|||||||
Renewable Diesel operating income (loss) |
$ |
(79 |
) |
|
$ |
112 |
|
|
$ |
(220 |
) |
|
$ |
302 |
Adjustments: |
|
|
|
|
|
|
|
|||||||
Operating expenses (excluding depreciation and amortization expense reflected below) |
|
72 |
|
|
|
80 |
|
|
|
150 |
|
|
|
170 |
Depreciation and amortization expense |
|
61 |
|
|
|
62 |
|
|
|
129 |
|
|
|
127 |
Renewable Diesel margin |
$ |
54 |
|
|
$ |
254 |
|
|
$ |
59 |
|
|
$ |
599 |
|
|
|
|
|
|
|
|
|||||||
Ethanol segment |
|
|
|
|
|
|
|
|||||||
Ethanol operating income |
$ |
54 |
|
|
$ |
105 |
|
|
$ |
74 |
|
|
$ |
115 |
Adjustments: |
|
|
|
|
|
|
|
|||||||
Operating expenses (excluding depreciation and amortization expense reflected below) |
|
144 |
|
|
|
125 |
|
|
|
298 |
|
|
|
262 |
Depreciation and amortization expense |
|
19 |
|
|
|
19 |
|
|
|
38 |
|
|
|
38 |
Other operating expenses (b) |
|
— |
|
|
|
(2 |
) |
|
|
— |
|
|
|
27 |
Ethanol margin |
$ |
217 |
|
|
$ |
247 |
|
|
$ |
410 |
|
|
$ |
442 |
|
|
|
|
|
|
|
|
|||||||
Ethanol operating income |
$ |
54 |
|
|
$ |
105 |
|
|
$ |
74 |
|
|
$ |
115 |
Adjustment: Other operating expenses (b) |
|
— |
|
|
|
(2 |
) |
|
|
— |
|
|
|
27 |
Adjusted Ethanol operating income |
$ |
54 |
|
|
$ |
103 |
|
|
$ |
74 |
|
|
$ |
142 |
See Notes to Earnings Release Tables. |
||||||||||||||
VALERO ENERGY CORPORATION |
|||||||||||
EARNINGS RELEASE TABLES |
|||||||||||
RECONCILIATION OF NON-GAAP MEASURES TO MOST COMPARABLE AMOUNTS |
|||||||||||
REPORTED UNDER U.S. GAAP (e) |
|||||||||||
(millions of dollars) |
|||||||||||
(unaudited) |
|||||||||||
|
Three Months Ended June 30, |
|
Six Months Ended June 30, |
||||||||
|
|
2025 |
|
|
2024 |
|
|
2025 |
|
|
2024 |
Reconciliation of Refining segment operating income (loss) to Refining margin (by region), and reconciliation of Refining segment operating income (loss) to adjusted Refining segment operating income (by region) (f) |
|
|
|
|
|
|
|
||||
U.S. Gulf Coast region |
|
|
|
|
|
|
|
||||
Refining operating income |
$ |
846 |
|
$ |
686 |
|
$ |
1,183 |
|
$ |
1,693 |
Adjustments: |
|
|
|
|
|
|
|
||||
Operating expenses (excluding depreciation and amortization expense reflected below) |
|
737 |
|
|
656 |
|
|
1,457 |
|
|
1,320 |
Depreciation and amortization expense |
|
387 |
|
|
377 |
|
|
763 |
|
|
750 |
Other operating expenses |
|
3 |
|
|
3 |
|
|
7 |
|
|
6 |
Refining margin |
$ |
1,973 |
|
$ |
1,722 |
|
$ |
3,410 |
|
$ |
3,769 |
|
|
|
|
|
|
|
|
||||
Refining operating income |
$ |
846 |
|
$ |
686 |
|
$ |
1,183 |
|
$ |
1,693 |
Adjustment: Other operating expenses |
|
3 |
|
|
3 |
|
|
7 |
|
|
6 |
Adjusted Refining operating income |
$ |
849 |
|
$ |
689 |
|
$ |
1,190 |
|
$ |
1,699 |
|
|
|
|
|
|
|
|
||||
U.S. Mid-Continent region |
|
|
|
|
|
|
|
||||
Refining operating income |
$ |
127 |
|
$ |
111 |
|
$ |
177 |
|
$ |
380 |
Adjustments: |
|
|
|
|
|
|
|
||||
Operating expenses (excluding depreciation and amortization expense reflected below) |
|
200 |
|
|
188 |
|
|
395 |
|
|
373 |
Depreciation and amortization expense |
|
78 |
|
|
88 |
|
|
154 |
|
|
175 |
Other operating expenses |
|
— |
|
|
— |
|
|
— |
|
|
2 |
Refining margin |
$ |
405 |
|
$ |
387 |
|
$ |
726 |
|
$ |
930 |
|
|
|
|
|
|
|
|
||||
Refining operating income |
$ |
127 |
|
$ |
111 |
|
$ |
177 |
|
$ |
380 |
Adjustment: Other operating expenses |
|
— |
|
|
— |
|
|
— |
|
|
2 |
Adjusted Refining operating income |
$ |
127 |
|
$ |
111 |
|
$ |
177 |
|
$ |
382 |
See Notes to Earnings Release Tables. |
|||||||||||
VALERO ENERGY CORPORATION |
||||||||||||
EARNINGS RELEASE TABLES |
||||||||||||
RECONCILIATION OF NON-GAAP MEASURES TO MOST COMPARABLE AMOUNTS |
||||||||||||
REPORTED UNDER U.S. GAAP (e) |
||||||||||||
(millions of dollars) |
||||||||||||
(unaudited) |
||||||||||||
|
Three Months Ended June 30, |
|
Six Months Ended June 30, |
|||||||||
|
|
2025 |
|
|
2024 |
|
|
2025 |
|
|
|
2024 |
Reconciliation of Refining segment operating income (loss) to Refining margin (by region), and reconciliation of Refining segment operating income (loss) to adjusted Refining segment operating income (by region) (f) (continued) |
|
|
|
|
|
|
|
|||||
North Atlantic region |
|
|
|
|
|
|
|
|||||
Refining operating income |
$ |
219 |
|
$ |
325 |
|
$ |
435 |
|
|
$ |
723 |
Adjustments: |
|
|
|
|
|
|
|
|||||
Operating expenses (excluding depreciation and amortization expense reflected below) |
|
182 |
|
|
176 |
|
|
354 |
|
|
|
355 |
Depreciation and amortization expense |
|
75 |
|
|
67 |
|
|
144 |
|
|
|
130 |
Other operating expenses |
|
— |
|
|
1 |
|
|
— |
|
|
|
1 |
Refining margin |
$ |
476 |
|
$ |
569 |
|
$ |
933 |
|
|
$ |
1,209 |
|
|
|
|
|
|
|
|
|||||
Refining operating income |
$ |
219 |
|
$ |
325 |
|
$ |
435 |
|
|
$ |
723 |
Adjustment: Other operating expenses |
|
— |
|
|
1 |
|
|
— |
|
|
|
1 |
Adjusted Refining operating income |
$ |
219 |
|
$ |
326 |
|
$ |
435 |
|
|
$ |
724 |
|
|
|
|
|
|
|
|
|||||
U.S. West Coast region |
|
|
|
|
|
|
|
|||||
Refining operating income (loss) |
$ |
74 |
|
$ |
102 |
|
$ |
(1,059 |
) |
|
$ |
173 |
Adjustments: |
|
|
|
|
|
|
|
|||||
Operating expenses (excluding depreciation and amortization expense reflected below) |
|
188 |
|
|
199 |
|
|
392 |
|
|
|
355 |
Depreciation and amortization expense (d) |
|
167 |
|
|
72 |
|
|
240 |
|
|
|
149 |
Asset impairment loss (a) |
|
— |
|
|
— |
|
|
1,131 |
|
|
|
— |
Other operating expenses |
|
1 |
|
|
1 |
|
|
1 |
|
|
|
1 |
Refining margin |
$ |
430 |
|
$ |
374 |
|
$ |
705 |
|
|
$ |
678 |
|
|
|
|
|
|
|
|
|||||
Refining operating income (loss) |
$ |
74 |
|
$ |
102 |
|
$ |
(1,059 |
) |
|
$ |
173 |
Adjustments: |
|
|
|
|
|
|
|
|||||
Asset impairment loss (a) |
|
— |
|
|
— |
|
|
1,131 |
|
|
|
— |
Other operating expenses |
|
1 |
|
|
1 |
|
|
1 |
|
|
|
1 |
Adjusted Refining operating income |
$ |
75 |
|
$ |
103 |
|
$ |
73 |
|
|
$ |
174 |
See Notes to Earnings Release Tables. |
||||||||||||
VALERO ENERGY CORPORATION |
|||||||||||
EARNINGS RELEASE TABLES |
|||||||||||
REFINING SEGMENT OPERATING HIGHLIGHTS |
|||||||||||
(millions of dollars, except per barrel amounts) |
|||||||||||
(unaudited) |
|||||||||||
|
Three Months Ended June 30, |
|
Six Months Ended June 30, |
||||||||
|
|
2025 |
|
|
2024 |
|
|
2025 |
|
|
2024 |
Throughput volumes (thousand barrels per day) |
|
|
|
|
|
|
|
||||
Feedstocks: |
|
|
|
|
|
|
|
||||
Heavy sour crude oil |
|
554 |
|
|
520 |
|
|
555 |
|
|
434 |
Medium/light sour crude oil |
|
240 |
|
|
265 |
|
|
237 |
|
|
253 |
Sweet crude oil |
|
1,509 |
|
|
1,530 |
|
|
1,535 |
|
|
1,518 |
Residuals |
|
167 |
|
|
201 |
|
|
131 |
|
|
176 |
Other feedstocks |
|
105 |
|
|
109 |
|
|
78 |
|
|
116 |
Total feedstocks |
|
2,575 |
|
|
2,625 |
|
|
2,536 |
|
|
2,497 |
Blendstocks and other |
|
347 |
|
|
385 |
|
|
339 |
|
|
388 |
Total throughput volumes |
|
2,922 |
|
|
3,010 |
|
|
2,875 |
|
|
2,885 |
|
|
|
|
|
|
|
|
||||
Yields (thousand barrels per day) |
|
|
|
|
|
|
|
||||
Gasolines and blendstocks |
|
1,444 |
|
|
1,490 |
|
|
1,410 |
|
|
1,419 |
Distillates |
|
1,111 |
|
|
1,144 |
|
|
1,094 |
|
|
1,068 |
Other products (g) |
|
392 |
|
|
407 |
|
|
394 |
|
|
423 |
Total yields |
|
2,947 |
|
|
3,041 |
|
|
2,898 |
|
|
2,910 |
|
|
|
|
|
|
|
|
||||
Operating statistics (e) (h) |
|
|
|
|
|
|
|
||||
Refining margin |
$ |
3,284 |
|
$ |
3,052 |
|
$ |
5,774 |
|
$ |
6,586 |
Adjusted Refining operating income |
$ |
1,270 |
|
$ |
1,229 |
|
$ |
1,875 |
|
$ |
2,979 |
Throughput volumes (thousand barrels per day) |
|
2,922 |
|
|
3,010 |
|
|
2,875 |
|
|
2,885 |
|
|
|
|
|
|
|
|
||||
Refining margin per barrel of throughput |
$ |
12.35 |
|
$ |
11.14 |
|
$ |
11.09 |
|
$ |
12.54 |
Less: |
|
|
|
|
|
|
|
||||
Operating expenses (excluding depreciation and amortization expense reflected below) per barrel of throughput |
|
4.91 |
|
|
4.45 |
|
|
4.99 |
|
|
4.58 |
Depreciation and amortization expense per barrel of throughput |
|
2.66 |
|
|
2.20 |
|
|
2.50 |
|
|
2.29 |
Adjusted Refining operating income per barrel of throughput |
$ |
4.78 |
|
$ |
4.49 |
|
$ |
3.60 |
|
$ |
5.67 |
See Notes to Earnings Release Tables. |
|||||||||||
VALERO ENERGY CORPORATION |
|||||||||||||
EARNINGS RELEASE TABLES |
|||||||||||||
RENEWABLE DIESEL SEGMENT OPERATING HIGHLIGHTS |
|||||||||||||
(millions of dollars, except per gallon amounts) |
|||||||||||||
(unaudited) |
|||||||||||||
|
Three Months Ended June 30, |
|
Six Months Ended June 30, |
||||||||||
|
|
2025 |
|
|
|
2024 |
|
|
2025 |
|
|
|
2024 |
Operating statistics (e) (h) |
|
|
|
|
|
|
|
||||||
Renewable Diesel margin |
$ |
54 |
|
|
$ |
254 |
|
$ |
59 |
|
|
$ |
599 |
Renewable Diesel operating income (loss) |
$ |
(79 |
) |
|
$ |
112 |
|
$ |
(220 |
) |
|
$ |
302 |
Sales volumes (thousand gallons per day) |
|
2,732 |
|
|
|
3,492 |
|
|
2,584 |
|
|
|
3,610 |
|
|
|
|
|
|
|
|
||||||
Renewable Diesel margin per gallon of sales |
$ |
0.22 |
|
|
$ |
0.80 |
|
$ |
0.13 |
|
|
$ |
0.91 |
Less: |
|
|
|
|
|
|
|
||||||
Operating expenses (excluding depreciation and amortization expense reflected below) per gallon of sales |
|
0.29 |
|
|
|
0.25 |
|
|
0.32 |
|
|
|
0.26 |
Depreciation and amortization expense per gallon of sales |
|
0.25 |
|
|
|
0.20 |
|
|
0.28 |
|
|
|
0.19 |
Renewable Diesel operating income (loss) per gallon of sales |
$ |
(0.32 |
) |
|
$ |
0.35 |
|
$ |
(0.47 |
) |
|
$ |
0.46 |
See Notes to Earnings Release Tables. |
|||||||||||||
VALERO ENERGY CORPORATION |
|||||||||||
EARNINGS RELEASE TABLES |
|||||||||||
ETHANOL SEGMENT OPERATING HIGHLIGHTS |
|||||||||||
(millions of dollars, except per gallon amounts) |
|||||||||||
(unaudited) |
|||||||||||
|
Three Months Ended June 30, |
|
Six Months Ended June 30, |
||||||||
|
|
2025 |
|
|
2024 |
|
|
2025 |
|
|
2024 |
Operating statistics (e) (h) |
|
|
|
|
|
|
|
||||
Ethanol margin |
$ |
217 |
|
$ |
247 |
|
$ |
410 |
|
$ |
442 |
Adjusted Ethanol operating income |
$ |
54 |
|
$ |
103 |
|
$ |
74 |
|
$ |
142 |
Production volumes (thousand gallons per day) |
|
4,583 |
|
|
4,474 |
|
|
4,525 |
|
|
4,470 |
|
|
|
|
|
|
|
|
||||
Ethanol margin per gallon of production |
$ |
0.52 |
|
$ |
0.61 |
|
$ |
0.50 |
|
$ |
0.54 |
Less: |
|
|
|
|
|
|
|
||||
Operating expenses (excluding depreciation and amortization expense reflected below) per gallon of production |
|
0.34 |
|
|
0.31 |
|
|
0.36 |
|
|
0.32 |
Depreciation and amortization expense per gallon of production |
|
0.05 |
|
|
0.05 |
|
|
0.05 |
|
|
0.05 |
Adjusted Ethanol operating income per gallon of production |
$ |
0.13 |
|
$ |
0.25 |
|
$ |
0.09 |
|
$ |
0.17 |
See Notes to Earnings Release Tables. |
|||||||||||
VALERO ENERGY CORPORATION |
|||||||||||
EARNINGS RELEASE TABLES |
|||||||||||
REFINING SEGMENT OPERATING HIGHLIGHTS BY REGION |
|||||||||||
(millions of dollars, except per barrel amounts) |
|||||||||||
(unaudited) |
|||||||||||
|
Three Months Ended June 30, |
|
Six Months Ended June 30, |
||||||||
|
|
2025 |
|
|
2024 |
|
|
2025 |
|
|
2024 |
Operating statistics by region (f) |
|
|
|
|
|
|
|
||||
U.S. Gulf Coast region (e) (h) |
|
|
|
|
|
|
|
||||
Refining margin |
$ |
1,973 |
|
$ |
1,722 |
|
$ |
3,410 |
|
$ |
3,769 |
Adjusted Refining operating income |
$ |
849 |
|
$ |
689 |
|
$ |
1,190 |
|
$ |
1,699 |
Throughput volumes (thousand barrels per day) |
|
1,841 |
|
|
1,827 |
|
|
1,756 |
|
|
1,711 |
|
|
|
|
|
|
|
|
||||
Refining margin per barrel of throughput |
$ |
11.78 |
|
$ |
10.36 |
|
$ |
10.72 |
|
$ |
12.11 |
Less: |
|
|
|
|
|
|
|
||||
Operating expenses (excluding depreciation and amortization expense reflected below) per barrel of throughput |
|
4.40 |
|
|
3.95 |
|
|
4.58 |
|
|
4.24 |
Depreciation and amortization expense per barrel of throughput |
|
2.31 |
|
|
2.27 |
|
|
2.40 |
|
|
2.41 |
Adjusted Refining operating income per barrel of throughput |
$ |
5.07 |
|
$ |
4.14 |
|
$ |
3.74 |
|
$ |
5.46 |
|
|
|
|
|
|
|
|
||||
U.S. Mid-Continent region (e) (h) |
|
|
|
|
|
|
|
||||
Refining margin |
$ |
405 |
|
$ |
387 |
|
$ |
726 |
|
$ |
930 |
Adjusted Refining operating income |
$ |
127 |
|
$ |
111 |
|
$ |
177 |
|
$ |
382 |
Throughput volumes (thousand barrels per day) |
|
423 |
|
|
438 |
|
|
438 |
|
|
444 |
|
|
|
|
|
|
|
|
||||
Refining margin per barrel of throughput |
$ |
10.52 |
|
$ |
9.73 |
|
$ |
9.16 |
|
$ |
11.49 |
Less: |
|
|
|
|
|
|
|
||||
Operating expenses (excluding depreciation and amortization expense reflected below) per barrel of throughput |
|
5.20 |
|
|
4.71 |
|
|
4.98 |
|
|
4.60 |
Depreciation and amortization expense per barrel of throughput |
|
2.01 |
|
|
2.22 |
|
|
1.94 |
|
|
2.16 |
Adjusted Refining operating income per barrel of throughput |
$ |
3.31 |
|
$ |
2.80 |
|
$ |
2.24 |
|
$ |
4.73 |
See Notes to Earnings Release Tables. |
|||||||||||
VALERO ENERGY CORPORATION |
|||||||||||
EARNINGS RELEASE TABLES |
|||||||||||
REFINING SEGMENT OPERATING HIGHLIGHTS BY REGION |
|||||||||||
(millions of dollars, except per barrel amounts) |
|||||||||||
(unaudited) |
|||||||||||
|
Three Months Ended June 30, |
|
Six Months Ended June 30, |
||||||||
|
|
2025 |
|
|
2024 |
|
|
2025 |
|
|
2024 |
Operating statistics by region (f) (continued) |
|
|
|
|
|
|
|
||||
North Atlantic region (e) (h) |
|
|
|
|
|
|
|
||||
Refining margin |
$ |
476 |
|
$ |
569 |
|
$ |
933 |
|
$ |
1,209 |
Adjusted Refining operating income |
$ |
219 |
|
$ |
326 |
|
$ |
435 |
|
$ |
724 |
Throughput volumes (thousand barrels per day) |
|
396 |
|
|
469 |
|
|
444 |
|
|
459 |
|
|
|
|
|
|
|
|
||||
Refining margin per barrel of throughput |
$ |
13.20 |
|
$ |
13.32 |
|
$ |
11.61 |
|
$ |
14.47 |
Less: |
|
|
|
|
|
|
|
||||
Operating expenses (excluding depreciation and amortization expense reflected below) per barrel of throughput |
|
5.04 |
|
|
4.12 |
|
|
4.40 |
|
|
4.24 |
Depreciation and amortization expense per barrel of throughput |
|
2.07 |
|
|
1.56 |
|
|
1.79 |
|
|
1.56 |
Adjusted Refining operating income per barrel of throughput |
$ |
6.09 |
|
$ |
7.64 |
|
$ |
5.42 |
|
$ |
8.67 |
|
|
|
|
|
|
|
|
||||
U.S. West Coast region (e) (h) |
|
|
|
|
|
|
|
||||
Refining margin |
$ |
430 |
|
$ |
374 |
|
$ |
705 |
|
$ |
678 |
Adjusted Refining operating income |
$ |
75 |
|
$ |
103 |
|
$ |
73 |
|
$ |
174 |
Throughput volumes (thousand barrels per day) |
|
262 |
|
|
276 |
|
|
237 |
|
|
271 |
|
|
|
|
|
|
|
|
||||
Refining margin per barrel of throughput |
$ |
18.02 |
|
$ |
14.86 |
|
$ |
16.42 |
|
$ |
13.76 |
Less: |
|
|
|
|
|
|
|
||||
Operating expenses (excluding depreciation and amortization expense reflected below) per barrel of throughput |
|
7.91 |
|
|
7.92 |
|
|
9.15 |
|
|
7.21 |
Depreciation and amortization expense per barrel of throughput (d) |
|
6.99 |
|
|
2.86 |
|
|
5.59 |
|
|
3.02 |
Adjusted Refining operating income per barrel of throughput |
$ |
3.12 |
|
$ |
4.08 |
|
$ |
1.68 |
|
$ |
3.53 |
See Notes to Earnings Release Tables. |
|||||||||||
VALERO ENERGY CORPORATION |
|||||||||||||||
EARNINGS RELEASE TABLES |
|||||||||||||||
AVERAGE MARKET REFERENCE PRICES AND DIFFERENTIALS |
|||||||||||||||
(unaudited) |
|||||||||||||||
|
Three Months Ended June 30, |
|
Six Months Ended June 30, |
||||||||||||
|
|
2025 |
|
|
|
2024 |
|
|
|
2025 |
|
|
|
2024 |
|
Refining |
|
|
|
|
|
|
|
||||||||
Feedstocks (dollars per barrel) |
|
|
|
|
|
|
|
||||||||
Brent crude oil |
$ |
66.59 |
|
|
$ |
84.96 |
|
|
$ |
70.74 |
|
|
$ |
83.40 |
|
Brent less West Texas Intermediate (WTI) crude oil |
|
2.72 |
|
|
|
4.22 |
|
|
|
3.08 |
|
|
|
4.49 |
|
Brent less WTI Houston crude oil |
|
1.89 |
|
|
|
2.73 |
|
|
|
1.99 |
|
|
|
2.83 |
|
Brent less Dated Brent crude oil |
|
(1.08 |
) |
|
|
0.09 |
|
|
|
(0.92 |
) |
|
|
(0.65 |
) |
Brent less Argus Sour Crude Index crude oil |
|
2.02 |
|
|
|
3.90 |
|
|
|
2.29 |
|
|
|
4.43 |
|
Brent less Maya crude oil |
|
8.11 |
|
|
|
11.49 |
|
|
|
8.95 |
|
|
|
11.89 |
|
Brent less Western Canadian Select Houston crude oil |
|
6.25 |
|
|
|
11.14 |
|
|
|
6.75 |
|
|
|
11.36 |
|
WTI crude oil |
|
63.87 |
|
|
|
80.74 |
|
|
|
67.67 |
|
|
|
78.91 |
|
|
|
|
|
|
|
|
|
||||||||
Natural gas (dollars per million British thermal units) |
|
2.83 |
|
|
|
1.74 |
|
|
|
3.11 |
|
|
|
1.77 |
|
|
|
|
|
|
|
|
|
||||||||
Renewable volume obligation (RVO) (dollars per barrel) (i) |
|
6.14 |
|
|
|
3.39 |
|
|
|
5.45 |
|
|
|
3.54 |
|
|
|
|
|
|
|
|
|
||||||||
Product margins (RVO adjusted unless otherwise noted) (dollars per barrel) |
|
|
|
|
|
|
|
||||||||
U.S. Gulf Coast: |
|
|
|
|
|
|
|
||||||||
Conventional Blendstock for Oxygenate Blending (CBOB) gasoline less Brent |
|
8.99 |
|
|
|
7.95 |
|
|
|
6.29 |
|
|
|
8.04 |
|
Ultra-low-sulfur (ULS) diesel less Brent |
|
14.79 |
|
|
|
14.12 |
|
|
|
15.74 |
|
|
|
19.37 |
|
Propylene less Brent (not RVO adjusted) |
|
(11.50 |
) |
|
|
(45.72 |
) |
|
|
(13.02 |
) |
|
|
(46.49 |
) |
U.S. Mid-Continent: |
|
|
|
|
|
|
|
||||||||
CBOB gasoline less WTI |
|
14.91 |
|
|
|
13.28 |
|
|
|
12.09 |
|
|
|
11.20 |
|
ULS diesel less WTI |
|
20.60 |
|
|
|
17.17 |
|
|
|
18.55 |
|
|
|
20.05 |
|
North Atlantic: |
|
|
|
|
|
|
|
||||||||
CBOB gasoline less Brent |
|
13.43 |
|
|
|
16.22 |
|
|
|
9.17 |
|
|
|
12.54 |
|
ULS diesel less Brent |
|
18.79 |
|
|
|
16.27 |
|
|
|
19.84 |
|
|
|
22.24 |
|
U.S. West Coast: |
|
|
|
|
|
|
|
||||||||
California Reformulated Gasoline Blendstock for Oxygenate Blending 87 gasoline less Brent |
|
36.98 |
|
|
|
31.88 |
|
|
|
30.06 |
|
|
|
25.91 |
|
California Air Resources Board diesel less Brent |
|
20.22 |
|
|
|
18.12 |
|
|
|
20.30 |
|
|
|
22.36 |
|
See Notes to Earnings Release Tables. |
|||||||||||||||
VALERO ENERGY CORPORATION |
|||||||||||
EARNINGS RELEASE TABLES |
|||||||||||
AVERAGE MARKET REFERENCE PRICES AND DIFFERENTIALS |
|||||||||||
(unaudited) |
|||||||||||
|
Three Months Ended June 30, |
|
Six Months Ended June 30, |
||||||||
|
|
2025 |
|
|
2024 |
|
|
2025 |
|
|
2024 |
Renewable Diesel |
|
|
|
|
|
|
|
||||
New York Mercantile Exchange ULS diesel (dollars per gallon) |
$ |
2.16 |
|
$ |
2.51 |
|
$ |
2.27 |
|
$ |
2.61 |
Biodiesel Renewable Identification Number (RIN) (dollars per RIN) |
|
1.09 |
|
|
0.51 |
|
|
0.94 |
|
|
0.55 |
California Low-Carbon Fuel Standard carbon credit (dollars per metric ton) |
|
52.36 |
|
|
51.29 |
|
|
59.27 |
|
|
57.42 |
U.S. Gulf Coast (USGC) used cooking oil (dollars per pound) |
|
0.56 |
|
|
0.42 |
|
|
0.53 |
|
|
0.41 |
USGC distillers corn oil (dollars per pound) |
|
0.59 |
|
|
0.46 |
|
|
0.56 |
|
|
0.47 |
USGC fancy bleachable tallow (dollars per pound) |
|
0.56 |
|
|
0.43 |
|
|
0.53 |
|
|
0.42 |
|
|
|
|
|
|
|
|
||||
Ethanol |
|
|
|
|
|
|
|
||||
Chicago Board of Trade corn (dollars per bushel) |
|
4.52 |
|
|
4.43 |
|
|
4.62 |
|
|
4.39 |
New York Harbor ethanol (dollars per gallon) |
|
1.84 |
|
|
1.90 |
|
|
1.83 |
|
|
1.77 |
VALERO ENERGY CORPORATION |
|||||
EARNINGS RELEASE TABLES |
|||||
OTHER FINANCIAL DATA |
|||||
(millions of dollars) |
|||||
(unaudited) |
|||||
|
June 30, |
|
December 31, |
||
|
|
2025 |
|
|
2024 |
Balance sheet data |
|
|
|
||
Current assets |
$ |
23,804 |
|
$ |
23,737 |
Cash and cash equivalents included in current assets |
|
4,537 |
|
|
4,657 |
Inventories included in current assets |
|
7,538 |
|
|
7,761 |
Current liabilities |
|
14,677 |
|
|
15,495 |
Valero Energy Corporation stockholders’ equity |
|
24,078 |
|
|
24,512 |
Total equity |
|
26,947 |
|
|
27,521 |
Debt and finance lease obligations: |
|
|
|
||
Debt – |
|
|
|
||
Current portion of debt (excluding variable interest entities (VIEs)) |
$ |
— |
|
$ |
441 |
Debt, less current portion of debt (excluding VIEs) |
|
8,233 |
|
|
7,586 |
Total debt (excluding VIEs) |
|
8,233 |
|
|
8,027 |
Current portion of debt attributable to VIEs |
|
137 |
|
|
58 |
Total debt |
|
8,370 |
|
|
8,085 |
Finance lease obligations – |
|
|
|
||
Current portion of finance lease obligations (excluding VIEs) |
|
217 |
|
|
217 |
Finance lease obligations, less current portion (excluding VIEs) |
|
1,404 |
|
|
1,492 |
Total finance lease obligations (excluding VIEs) |
|
1,621 |
|
|
1,709 |
Current portion of finance lease obligations attributable to VIEs |
|
28 |
|
|
27 |
Finance lease obligations, less current portion attributable to VIEs |
|
628 |
|
|
642 |
Total finance lease obligations attributable to VIEs |
|
656 |
|
|
669 |
Total finance lease obligations |
|
2,277 |
|
|
2,378 |
Total debt and finance lease obligations |
$ |
10,647 |
|
$ |
10,463 |
|
Three Months Ended June 30, |
|
Six Months Ended June 30, |
||||||||||
|
|
2025 |
|
|
|
2024 |
|
|
2025 |
|
|
|
2024 |
Reconciliation of net cash provided by operating activities to adjusted net cash provided by operating activities (e) |
|
|
|
|
|
|
|
||||||
Net cash provided by operating activities |
$ |
936 |
|
|
$ |
2,472 |
|
$ |
1,888 |
|
|
$ |
4,318 |
Exclude: |
|
|
|
|
|
|
|
||||||
Changes in current assets and current liabilities |
|
(325 |
) |
|
|
789 |
|
|
(168 |
) |
|
|
629 |
Diamond Green Diesel LLC’s (DGD) adjusted net cash provided by (used in) operating activities attributable to the other joint venture member’s ownership interest in DGD |
|
(86 |
) |
|
|
83 |
|
|
(153 |
) |
|
|
205 |
Adjusted net cash provided by operating activities |
$ |
1,347 |
|
|
$ |
1,600 |
|
$ |
2,209 |
|
|
$ |
3,484 |
See Notes to Earnings Release Tables. |
|||||||||||||
VALERO ENERGY CORPORATION |
|||||||||||||||
EARNINGS RELEASE TABLES |
|||||||||||||||
OTHER FINANCIAL DATA |
|||||||||||||||
(millions of dollars, except per share amounts) |
|||||||||||||||
(unaudited) |
|||||||||||||||
|
Three Months Ended June 30, |
|
Six Months Ended June 30, |
||||||||||||
|
|
2025 |
|
|
|
2024 |
|
|
|
2025 |
|
|
|
2024 |
|
Reconciliation of capital investments to capital investments attributable to Valero (e) |
|
|
|
|
|
|
|
||||||||
Capital expenditures (excluding VIEs) |
$ |
144 |
|
|
$ |
119 |
|
|
$ |
333 |
|
|
$ |
247 |
|
Capital expenditures of VIEs: |
|
|
|
|
|
|
|
||||||||
DGD |
|
4 |
|
|
|
73 |
|
|
|
63 |
|
|
|
142 |
|
Other VIEs |
|
2 |
|
|
|
2 |
|
|
|
3 |
|
|
|
5 |
|
Deferred turnaround and catalyst cost expenditures (excluding VIEs) |
|
247 |
|
|
|
184 |
|
|
|
621 |
|
|
|
636 |
|
Deferred turnaround and catalyst cost expenditures of DGD |
|
10 |
|
|
|
42 |
|
|
|
46 |
|
|
|
51 |
|
Investments in nonconsolidated joint ventures |
|
— |
|
|
|
— |
|
|
|
1 |
|
|
|
— |
|
Capital investments |
|
407 |
|
|
|
420 |
|
|
|
1,067 |
|
|
|
1,081 |
|
Adjustments: |
|
|
|
|
|
|
|
||||||||
DGD’s capital investments attributable to the other joint venture member |
|
(6 |
) |
|
|
(58 |
) |
|
|
(54 |
) |
|
|
(97 |
) |
Capital expenditures of other VIEs |
|
(2 |
) |
|
|
(2 |
) |
|
|
(3 |
) |
|
|
(5 |
) |
Capital investments attributable to Valero |
$ |
399 |
|
|
$ |
360 |
|
|
$ |
1,010 |
|
|
$ |
979 |
|
|
|
|
|
|
|
|
|
||||||||
Dividends per common share |
$ |
1.13 |
|
|
$ |
1.07 |
|
|
$ |
2.26 |
|
|
$ |
2.14 |
|
See Notes to Earnings Release Tables. |
|||||||||||||||
VALERO ENERGY CORPORATION NOTES TO EARNINGS RELEASE TABLES |
||
(a) |
|
In March 2025, we approved a plan with respect to the operations at our Benicia Refinery and currently intend to cease refining operations by the end of April 2026. In addition, we considered strategic alternatives for our remaining operations in California. As a result, we evaluated the assets of the Benicia and Wilmington refineries for impairment as of March 31, 2025 and concluded that the carrying values of these assets were not recoverable. Therefore, we reduced the carrying values of the Benicia and Wilmington refineries to their estimated fair values and recognized a combined asset impairment loss of $1.1 billion in the six months ended June 30, 2025. |
(b) |
|
In March 2021, we announced our participation in a then-proposed large-scale carbon capture and sequestration pipeline system with Navigator Energy Services (Navigator). In October 2023, Navigator announced that it decided to cancel this project. Under the terms of the agreements associated with the project, we had some rights from and obligations to Navigator, including a portion of the aggregate project costs. As a result, we recognized a charge of $29 million in the six months ended June 30, 2024 related to our obligation to Navigator. |
(c) |
|
In December 2024, the Internal Revenue Service approved our application for registration as a producer of second-generation biofuels with respect to the cellulosic ethanol produced at our ethanol plants. As a result, we recognized a current income tax benefit of $79 million in December 2024 for the tax credit attributable to volumes of cellulosic ethanol produced and sold by us in the U.S. from 2020 through 2024. Of the $79 million benefit, $7 million and $14 million is attributable to the three and six months ended June 30, 2024, respectively. |
(d) |
|
Depreciation and amortization expense for the three and six months ended June 30, 2025 includes incremental depreciation expense of approximately $100 million related to the Benicia Refinery. In connection with our plan to cease refining operations at our Benicia Refinery, we shortened the estimated useful life of the refinery, and as a result, will depreciate the revised carrying value of the refinery’s long-lived assets to the estimated salvage value through April 2026. |
|
|
|
(e) |
|
We use certain financial measures (as noted below) in the earnings release tables and accompanying earnings release that are not defined under GAAP and are considered to be non-GAAP measures. |
|
|
|
|
|
We have defined these non-GAAP measures and believe they are useful to the external users of our financial statements, including industry analysts, investors, lenders, and rating agencies. We believe these measures are useful to assess our ongoing financial performance because, when reconciled to their most comparable GAAP measures, they provide improved comparability between periods after adjusting for certain items that we believe are not indicative of our core operating performance and that may obscure our underlying business results and trends. These non-GAAP measures should not be considered as alternatives to their most comparable GAAP measures nor should they be considered in isolation or as a substitute for an analysis of our results of operations as reported under GAAP. In addition, these non-GAAP measures may not be comparable to similarly titled measures used by other companies because we may define them differently, which diminishes their utility. |
|
|
|
|
|
Non-GAAP measures are as follows: |
|
|
|
|
|
|
|
|
– Asset impairment loss – The asset impairment loss attributable to our Benicia and Wilmington refineries (see note (a)) is not indicative of our ongoing operations or our expectations about the profitability of our refining business. |
|
|
|
|
|
– Project liability adjustment – The project liability adjustment related to the cancellation of Navigator’s project (see note (b)) is not indicative of our ongoing operations. |
|
|
|
|
|
– Second-generation biofuel tax credit – The income tax benefit from the second-generation biofuel tax credit recognized by us in December 2024 is attributable to volumes produced and sold from 2020 to 2024 (see note (c)). Therefore, the adjustment reflects the portion of the credit that is attributable to volumes produced and sold during the three and six months ended June 30, 2024. |
|
|
|
|
|
|
|
|
|
|
|
|
|
|
|
|
|
|
|
|
|
|
|
|
|
|
– Changes in current assets and current liabilities – Current assets net of current liabilities represents our operating liquidity. We believe that the change in our operating liquidity from period to period does not represent cash generated by our operations that is available to fund our investing and financing activities. |
|
|
|
|
|
– DGD’s adjusted net cash provided by operating activities attributable to the other joint venture member’s ownership interest in DGD – We are a 50 percent joint venture member in DGD and we consolidate DGD’s financial statements. Our Renewable Diesel segment includes the operations of DGD and the associated activities to market its products. Because we consolidate DGD’s financial statements, all of DGD’s net cash provided by operating activities (or operating cash flow) is included in our consolidated net cash provided by operating activities. |
|
|
|
|
|
In general, DGD’s members use DGD’s operating cash flow (excluding changes in its current assets and current liabilities) to fund its capital investments rather than distribute all of that cash to themselves. Nevertheless, DGD’s operating cash flow is effectively attributable to each member and only a portion of DGD’s operating cash flow should be attributed to our net cash provided by operating activities. Therefore, we have adjusted our net cash provided by operating activities for the portion of DGD’s operating cash flow attributable to the other joint venture member’s ownership interest because we believe that it more accurately reflects the operating cash flow available to us to fund our investing and financing activities. The adjustment is calculated as follows (in millions): |
|
Three Months Ended June 30, |
|
Six Months Ended June 30, |
||||||||||||
|
|
2025 |
|
|
|
2024 |
|
|
|
2025 |
|
|
|
2024 |
|
DGD operating cash flow data |
|
|
|
|
|
|
|
||||||||
Net cash provided by (used in) operating activities |
$ |
(262 |
) |
|
$ |
451 |
|
|
$ |
(101 |
) |
|
$ |
445 |
|
Exclude: Changes in current assets and current liabilities |
|
(89 |
) |
|
|
285 |
|
|
|
205 |
|
|
|
35 |
|
Adjusted net cash provided by (used in) operating activities |
|
(173 |
) |
|
|
166 |
|
|
|
(306 |
) |
|
|
410 |
|
Other joint venture member’s ownership interest |
|
50 |
% |
|
|
50 |
% |
|
|
50 |
% |
|
|
50 |
% |
DGD’s adjusted net cash provided by (used in) operating activities attributable to the other joint venture member’s ownership interest in DGD |
$ |
(86 |
) |
|
$ |
83 |
|
|
$ |
(153 |
) |
|
$ |
205 |
|
|
|
|
| (f) | The Refining segment regions reflected herein contain the following refineries: U.S. Gulf Coast- Corpus Christi East, Corpus Christi West, Houston, Meraux, Port Arthur, St. Charles, Texas City, and Three Rivers Refineries; U.S. Mid Continent- Ardmore, McKee, and Memphis Refineries; North Atlantic- Pembroke and Quebec City Refineries; and U.S. West Coast- Benicia and Wilmington Refineries. |
|
| (g) | Primarily includes petrochemicals, gas oils, No. 6 fuel oil, petroleum coke, sulfur, and asphalt. |
|
| (h) | We use certain operating statistics (as noted below) in the earnings release tables and the accompanying earnings release to evaluate performance between comparable periods. Different companies may calculate them in different ways. |
|
All per barrel of throughput, per gallon of sales, and per gallon of production amounts are calculated by dividing the associated dollar amount by the throughput volumes, sales volumes, and production volumes for the period, as applicable. |
||
Throughput volumes, sales volumes, and production volumes are calculated by multiplying throughput volumes per day, sales volumes per day, and production volumes per day (as provided in the accompanying tables), respectively, by the number of days in the applicable period. We use throughput volumes, sales volumes, and production volumes for the Refining segment, Renewable Diesel segment, and Ethanol segment, respectively, due to their general use by others who operate facilities similar to those included in our segments. We believe the use of such volumes results in per unit amounts that are most representative of the product margins generated and the operating costs incurred as a result of our operation of those facilities. |
||
| (i) | The RVO cost represents the average market cost on a per barrel basis to comply with the Renewable Fuel Standard program. The RVO cost is calculated by multiplying (i) the average market price during the applicable period for the RINs associated with each class of renewable fuel (i.e., biomass-based diesel, cellulosic biofuel, advanced biofuel, and total renewable fuel) by (ii) the quotas for the volume of each class of renewable fuel that must be blended into petroleum-based transportation fuels consumed in the U.S., as set or proposed by the U.S. Environmental Protection Agency, on a percentage basis for each class of renewable fuel and adding together the results of each calculation. |
View source version on businesswire.com: https://www.businesswire.com/news/home/20250723854623/en/
Contacts
Valero Contacts
Investors:
Homer Bhullar, Vice President – Investor Relations and Finance, 210-345-1982
Eric Herbort, Director – Investor Relations and Finance, 210-345-3331
Gautam Srivastava, Director – Investor Relations, 210-345-3992
Media:
Lillian Riojas, Executive Director – Media Relations and Communications, 210-345-5002