
Engine manufacturer Cummins (NYSE: CMI) reported Q1 CY2025 results beating Wall Street’s revenue expectations, but sales fell by 2.7% year on year to $8.17 billion. Its GAAP profit of $5.96 per share was 23% above analysts’ consensus estimates.
Is now the time to buy Cummins? Find out by accessing our full research report, it’s free.
Cummins (CMI) Q1 CY2025 Highlights:
- Revenue: $8.17 billion vs analyst estimates of $8.13 billion (2.7% year-on-year decline, 0.6% beat)
- EPS (GAAP): $5.96 vs analyst estimates of $4.85 (23% beat)
- Adjusted EBITDA: $1.46 billion vs analyst estimates of $1.31 billion (17.9% margin, 11.2% beat)
- Operating Margin: 13.9%, up from 11% in the same quarter last year
- Free Cash Flow was -$165 million, down from $107 million in the same quarter last year
- Market Capitalization: $41.3 billion
“The company delivered strong financial results in the first quarter of 2025 led by record performance in our Power Systems Segment,” said Jennifer Rumsey, Chair and CEO.
Company Overview
With more than half of the heavy-duty truck market using its engines at one point, Cummins (NYSE: CMI) offers engines and power systems.
Sales Growth
Reviewing a company’s long-term sales performance reveals insights into its quality. Any business can experience short-term success, but top-performing ones enjoy sustained growth for years. Thankfully, Cummins’s 8.5% annualized revenue growth over the last five years was decent. Its growth was slightly above the average industrials company and shows its offerings resonate with customers.
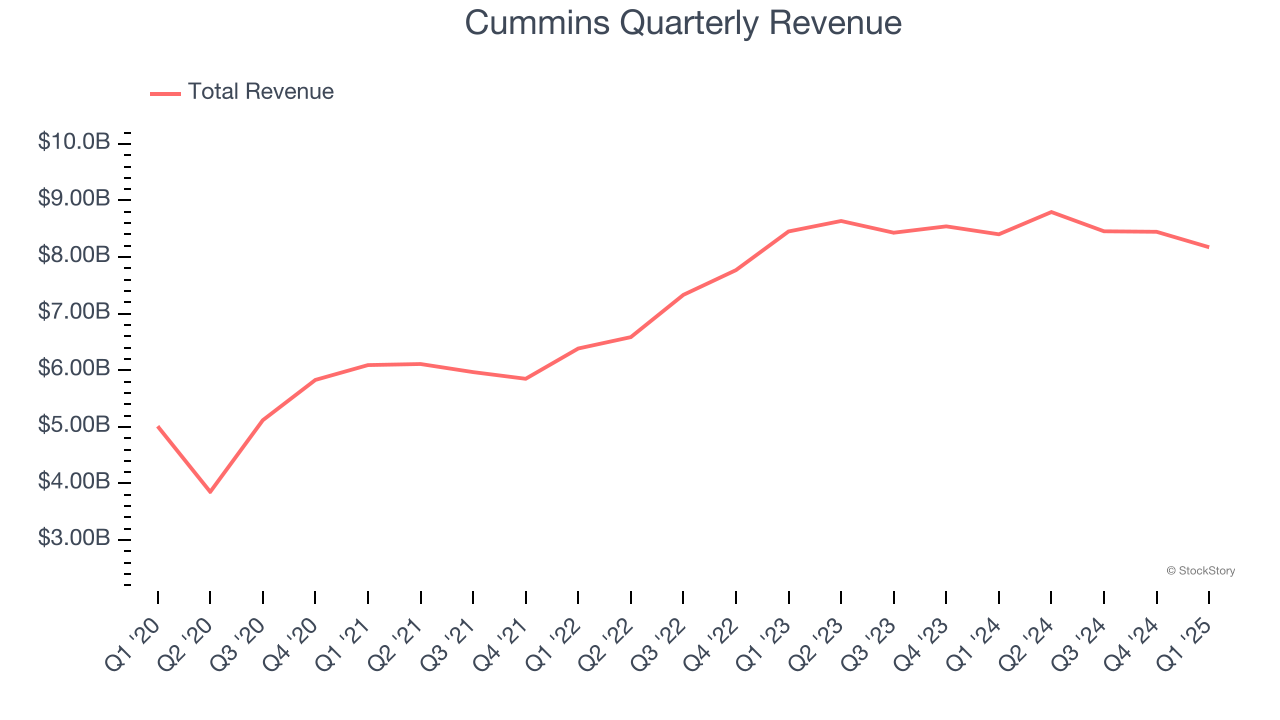
We at StockStory place the most emphasis on long-term growth, but within industrials, a half-decade historical view may miss cycles, industry trends, or a company capitalizing on catalysts such as a new contract win or a successful product line. Cummins’s recent performance shows its demand has slowed as its annualized revenue growth of 6% over the last two years was below its five-year trend. 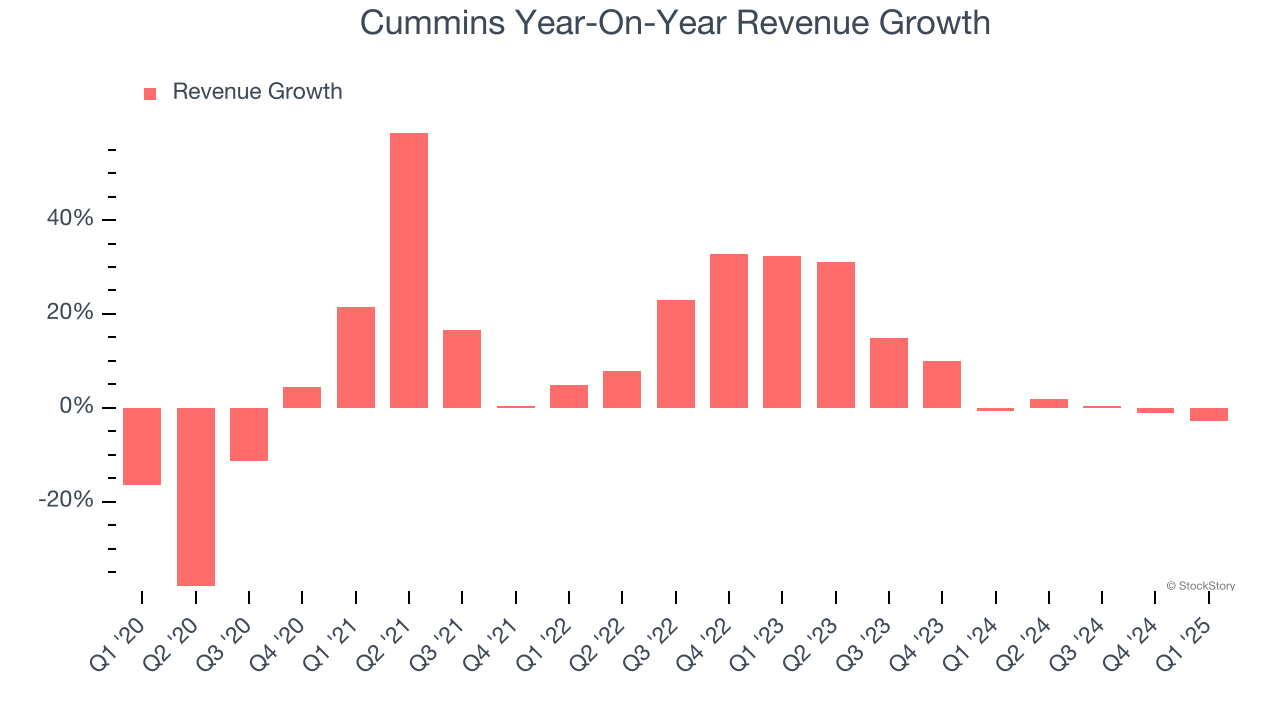
We can better understand the company’s revenue dynamics by analyzing its most important segments, Components and Engine , which are 33% and 34.3% of revenue. Over the last two years, Cummins’s Components revenue (axles, brakes, drivelines) averaged 3.4% year-on-year growth while its Engine revenue (diesel and gas-powered engines) averaged 1.9% growth.
This quarter, Cummins’s revenue fell by 2.7% year on year to $8.17 billion but beat Wall Street’s estimates by 0.6%.
Looking ahead, sell-side analysts expect revenue to remain flat over the next 12 months, a deceleration versus the last two years. This projection doesn't excite us and implies its products and services will face some demand challenges.
Software is eating the world and there is virtually no industry left that has been untouched by it. That drives increasing demand for tools helping software developers do their jobs, whether it be monitoring critical cloud infrastructure, integrating audio and video functionality, or ensuring smooth content streaming. Click here to access a free report on our 3 favorite stocks to play this generational megatrend.
Operating Margin
Cummins has done a decent job managing its cost base over the last five years. The company has produced an average operating margin of 9.7%, higher than the broader industrials sector.
Looking at the trend in its profitability, Cummins’s operating margin might fluctuated slightly but has generally stayed the same over the last five years. This raises questions about the company’s expense base because its revenue growth should have given it leverage on its fixed costs, resulting in better economies of scale and profitability.
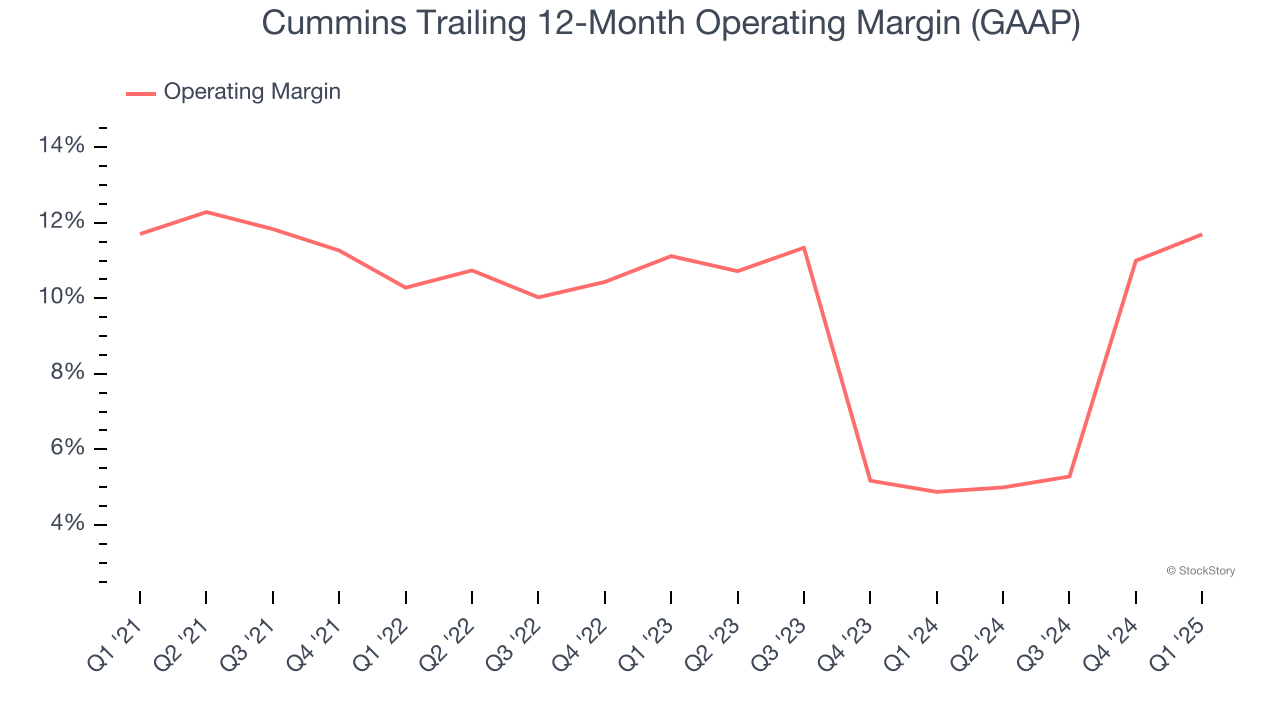
In Q1, Cummins generated an operating profit margin of 13.9%, up 2.9 percentage points year on year. The increase was encouraging, and because its operating margin rose more than its gross margin, we can infer it was more efficient with expenses such as marketing, R&D, and administrative overhead.
Earnings Per Share
Revenue trends explain a company’s historical growth, but the long-term change in earnings per share (EPS) points to the profitability of that growth – for example, a company could inflate its sales through excessive spending on advertising and promotions.
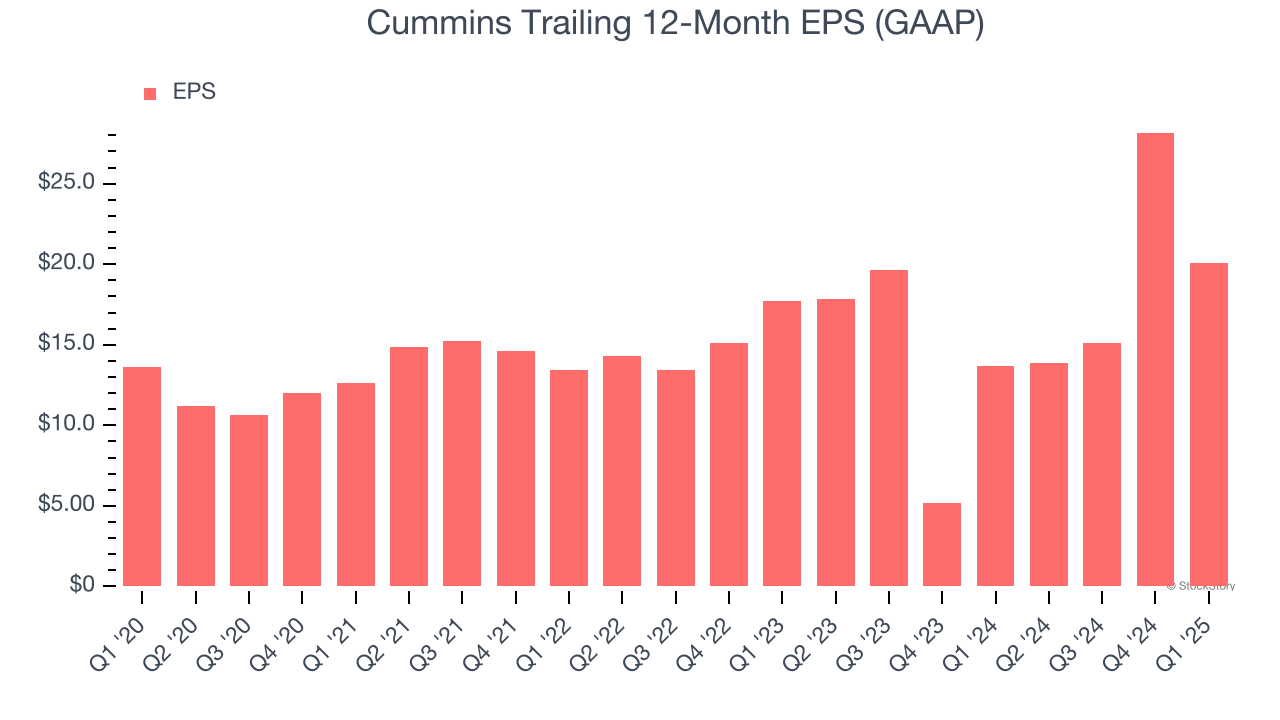
Cummins’s decent 8.1% annual EPS growth over the last five years aligns with its revenue performance. This tells us it maintained its per-share profitability as it expanded.
Like with revenue, we analyze EPS over a shorter period to see if we are missing a change in the business.
For Cummins, its two-year annual EPS growth of 6.4% was lower than its five-year trend. We hope its growth can accelerate in the future.
In Q1, Cummins reported EPS at $5.96, down from $14.03 in the same quarter last year. Despite falling year on year, this print easily cleared analysts’ estimates. Over the next 12 months, Wall Street expects Cummins’s full-year EPS of $20.10 to shrink by 3.8%.
Key Takeaways from Cummins’s Q1 Results
We were impressed by how significantly Cummins blew past analysts’ EBITDA expectations this quarter. We were also glad its revenue and EPS outperformed Wall Street’s estimates. Zooming out, we think this quarter featured some important positives. The stock remained flat at $298 immediately after reporting.
So do we think Cummins is an attractive buy at the current price? If you’re making that decision, you should consider the bigger picture of valuation, business qualities, as well as the latest earnings. We cover that in our actionable full research report which you can read here, it’s free.


