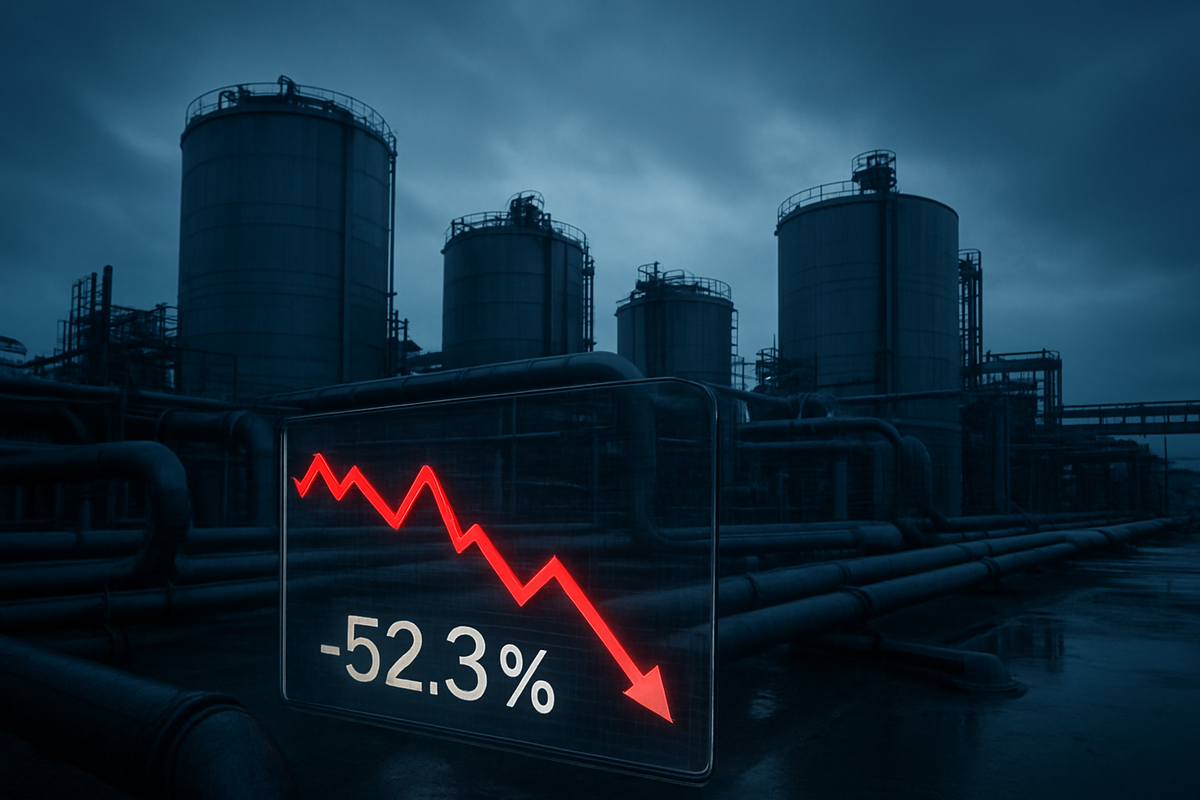
The North American energy market is reeling from a "localized crisis of abundance" following a historic collapse in natural gas prices throughout February 2026. According to the latest Commodity Markets Outlook from the World Bank, U.S. benchmark natural gas prices cratered by 52.3% last month, a move that has effectively wiped out the gains seen during the brief but intense January energy squeeze.
This dramatic downward spiral—one of the most violent price corrections in the history of the Henry Hub—has sent shockwaves through the energy sector. While the collapse is a blow to the bottom lines of major producers, it has simultaneously provided a massive, unexpected windfall for energy-intensive manufacturers, offering a rare margin boost in an otherwise inflationary global economy. As of mid-March 2026, the market remains in a state of flux as storage facilities continue to bulge with unseasonably high reserves.
From Peak to Pit: The 30-Day Freefall
The volatility of early 2026 began with a roar and ended with a whimper. In late January, "Winter Storm Fern" swept across the United States, triggering record-breaking storage withdrawals and momentarily pushing spot prices at the Henry Hub to a staggering $30.72 per MMBtu on January 23. However, as the storm dissipated, it was replaced by a "heatwave-free winter"—a period of unseasonably warm temperatures that effectively neutralized residential heating demand for the remainder of the season.
By the first week of February, the "weather premium" that had inflated prices vanished. According to World Bank data, the subsequent 52.3% drop was fueled by a "perfect storm" of record-high production and physical infrastructure bottlenecks. U.S. dry natural gas production reached an all-time high of approximately 120 billion cubic feet per day (Bcf/d) in February, far outstripping a domestic consumption rate that softened to just 91.4 Bcf/d. The imbalance became so severe that by mid-February, the market witnessed a rare phenomenon: winter storage injections. Instead of drawing gas out to heat homes, operators were forced to pump surplus gas back into the ground, a practice usually reserved for the spring and summer "shoulder" seasons.
The situation was further exacerbated by localized gluts in the Permian Basin. At the Waha Hub in West Texas, infrastructure bottlenecks became so constrained that gas essentially became "trapped," leading to instances of negative spot pricing where producers were forced to pay off-takers to move their fuel. The delay of major export projects, including Golden Pass LNG and Phase 2 of the Plaquemines LNG terminal, meant that the U.S. lacked the incremental "venting" capacity needed to send this surplus to higher-priced markets in Europe and Asia.
Winners and Losers in the Methane Glut
The 52% price collapse has created a stark divide across the corporate landscape. On the losing side are the pure-play upstream producers who are now facing significant margin compression. EQT Corporation (NYSE: EQT) and the newly formed Expand Energy (NASDAQ: EXE)—the entity resulting from the merger of Chesapeake and Southwestern—have been forced to pivot toward "drillers' discipline." These firms are now eyeing production curtailments and the delaying of well completions to avoid selling into a depressed market. ExxonMobil (NYSE: XOM) and Chevron (NYSE: CVX), while diversified, are also feeling the sting in their domestic upstream segments, though their global footprints offer some insulation.
Conversely, the "Methane Meltdown" has been a boon for energy-intensive manufacturers. For firms like CF Industries (NYSE: CF), the world’s largest producer of ammonia, natural gas represents the primary raw material cost. The 52% drop in gas prices has significantly lowered their input costs, even as fertilizer prices rose 6.5% in February, creating a widening margin of profit. Similarly, steel giant Nucor (NYSE: NUE) and chemical powerhouse Dow Inc. (NYSE: DOW) are seeing a rare tailwind. These companies are now benefiting from some of the lowest industrial energy costs in the developed world, providing them a significant competitive edge over European rivals who remain tethered to expensive, volatile energy imports.
Midstream and export players occupy a more complex middle ground. Cheniere Energy (NYSE: LNG) continues to profit from the "global arbitrage"—the massive spread between dirt-cheap U.S. gas and high prices in the EU and Asia. However, the World Bank warns that if domestic prices remain too low for too long, it could jeopardize the long-term capital expenditure plans for the next wave of LNG infrastructure, potentially slowing the U.S. transition into a global energy superpower.
A Decoupling of Global Markets
The 2026 crash highlights a growing "violent decoupling" between U.S. and international energy markets. While the U.S. struggles with a crisis of abundance, the European Union remains in a state of high-volatility anxiety. This divergence is partly fueled by domestic policy; the 2025 "One Big Beautiful Bill" (OBBB) Act in the U.S. significantly incentivized domestic production and repealed various methane fees, leading to the current supply surge. In contrast, the EU’s focus on market correction mechanisms and price caps has kept their internal prices artificially high compared to the American benchmark.
Historically, this event draws parallels to the "First Shale Glut" of 2012 and the pandemic-driven lows of 2020. However, 2026 is distinct because demand is fundamentally higher today, driven by the massive power requirements of AI data centers. The fact that prices could still collapse by 52% despite this underlying demand growth underscores just how efficient—and perhaps over-leveraged—the U.S. shale machine has become. The "digital oilfield" and improved winterization standards post-2021 have allowed producers to maintain record output even in harsh conditions, ironically contributing to the very oversupply that is now depressing their profits.
The Road Ahead: A Summer of Storage Stress?
Looking toward the second half of 2026, the primary concern for the market is storage capacity. If the current trajectory of record production and mild weather continues, the U.S. could hit "tank tops"—reaching absolute maximum storage capacity—well before the next winter season begins. This scenario would likely lead to even deeper price cuts or mandatory production shut-ins across the Appalachian and Permian basins.
However, a strategic pivot is already underway. Many producers have begun aggressive hedging programs, with EQT recently moving to hedge over 25% of its 2026 production to lock in price floors. Furthermore, as the delayed LNG trains at Golden Pass and Plaquemines finally come online in late 2026, the market expects a slow rebalancing. These new facilities will add approximately 6–8 Bcf/d of incremental demand, which many analysts believe will put a firm floor under prices by the fourth quarter.
Investor Takeaway and Market Outlook
The February 2026 natural gas crash is a potent reminder of the "feast or famine" nature of the energy markets. While the headline 52.3% drop is a staggering blow to the energy sector's short-term earnings, it serves as a massive stimulus for the broader U.S. manufacturing base. The primary takeaway for investors is the emergence of a "localized glut" that favors domestic consumers over producers, at least until export capacity can catch up with the shale revolution's latest surge.
In the coming months, investors should closely monitor weekly EIA storage reports for signs of early "tank top" symptoms and watch for any regulatory shifts regarding the Jones Act, which could allow foreign tankers to help move domestic supply between U.S. ports. The resilience of the $3.00/MMBtu support level will be the key indicator for whether the market has found its bottom or if the "Methane Meltdown" has further to run.
This content is intended for informational purposes only and is not financial advice.