Among tech companies, Microchip Technology (MCHP) is one of the more difficult names to decipher. As a developer and manufacturer of microcontrollers, memory and interface products for embedded control systems, Microchip represents one of the important cogs in the broader semiconductor industry. At the same time, investors haven’t exactly been thrilled with MCHP stock and its performance.
It’s not that the return is bad, per se. Since the start of the year, MCHP stock has gained over 13%. With a trailing-month performance of over 21%, when things go well, they can be exceptional. However, it’s also fair to point out that the benchmark S&P 500 is up nearly 18% since the beginning of January. Naturally, investors are looking for a bit more growth out of their innovators.
Frankly, the options market also isn’t providing much support for the bulls. On Friday, Barchart’s options flow screener — which focuses exclusively on big block transactions likely placed by institutional investors — revealed that net trade sentiment declined by $70,600 on Friday. Even more problematic, the overall sentiment was overwhelmingly negative last week, with Monday and Wednesday combining for a negative flow of $713.2 million.
Interestingly, the options market anticipates a sizable swing in MCHP stock over the next several weeks. For example, the Expected Move calculator — which incorporates implied volatility (IV) into a proprietary Black-Scholes-based formulation — reveals that for the Feb. 20, 2026, options chain, MCHP could land between $57.42 and $72.46. This translates to an 11.58% high-low spread from the anchor price of $64.94, Friday’s close.
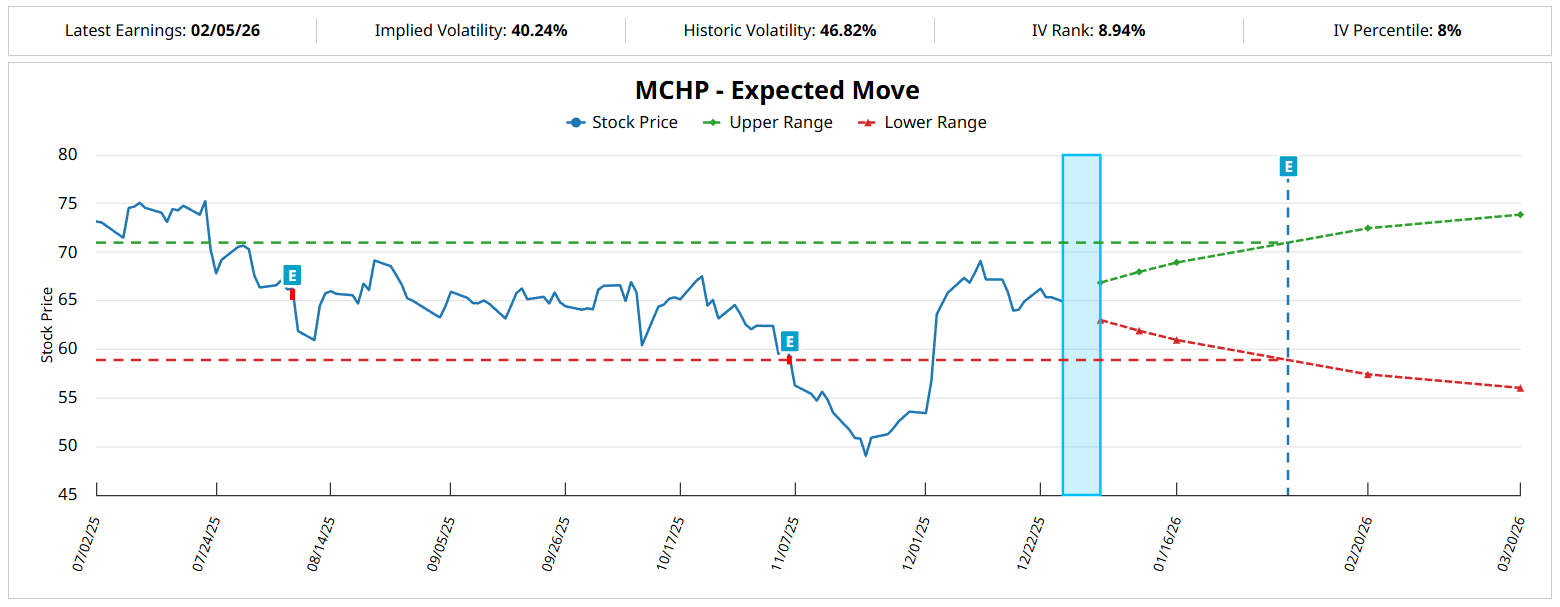
To be sure, there could be a technical reflexivity case here. For instance, on Nov. 20, MCHP stock was trading around $49 before a resurgence of positive sentiment in the tech ecosystem helped skyrocket the share value. It’s possible that a similar move could occur, given that in the past six months, MCHP is down 8%.
Still, I propose that there’s a more precise way of trading this anticipated reflexivity without leaning too heavily on narrative scaffoldings.
Using Risk Topography to Trade MCHP Stock
While options trading naturally offers heightened reward potential due to the underlying leverage, the nature of these derivative instruments naturally raises complexities. Unlike betting on open-market securities — where a thesis being temporarily wrong can possibly be corrected through extended exposure — there’s no such mercy in the options market.
Prior to the move happening, a trader must choose a specific strike price and a time window. And prior to expiration, those who have gambled are exposed to non-linear payoffs and noncontinuous error profiles. Put another way, you usually can’t be somewhat right, as this phrase often has a very tight window.
To better align our strategies with the wild dynamics found in options trading, I use a quantitative model through a discretized and iterated lens. Later, through a hierarchical framework, I uncover the structure of risk. Basically, the idea is that repeated trials of price behaviors reveal behavioral tendencies that would otherwise get lost in the noise.
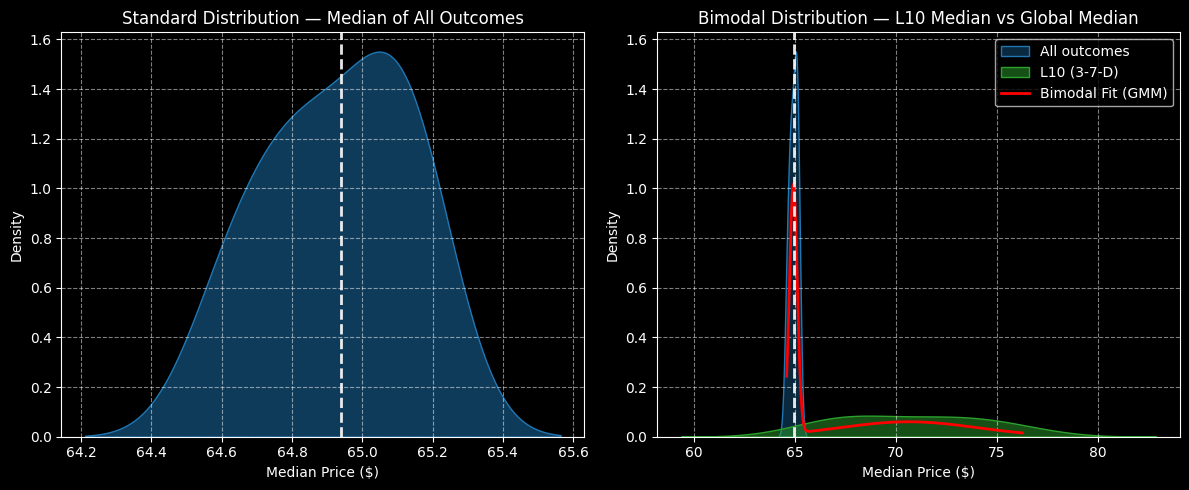
Using data from January 2019 onward, the forward 10-week returns of MCHP stock would likely range between $64.20 and $65.60, with price clustering likely to be predominant at around $65.05 (assuming again an anchor price of $64.94). Therefore, on any given 10-week period, Microchip stock carries a slightly negative bias.
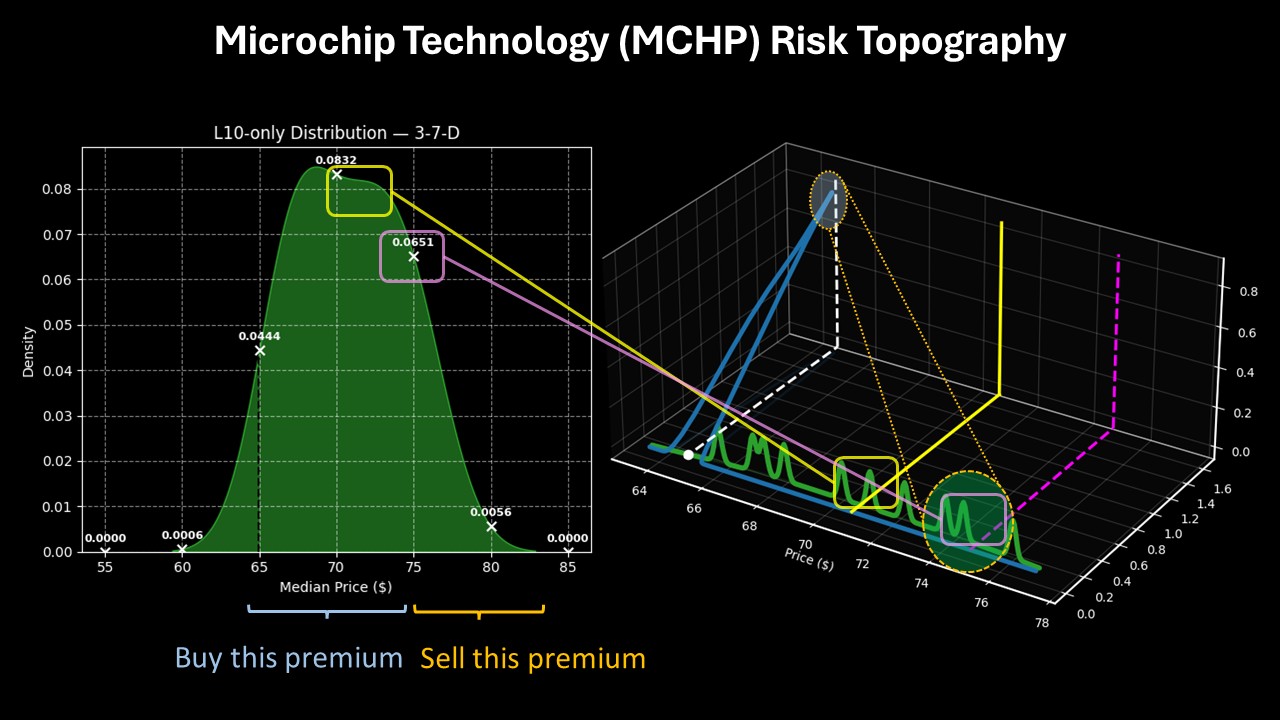
However, we’re interested in isolating for the current quantitative signal, which is the 3-7-D sequence. In the past 10 weeks, MCHP stock has printed only three up weeks, leading to an overall downward slope. Under this setup, the forward 10-week returns would likely range between $60 and $83, with price clustering likely occurring at $68.
However, we know through risk topography — or a three-dimensional view of risk-reward asymmetries — that a significant amount of activity may materialize around the $70 level. Therefore, probability density doesn’t just peak at $68 and drop off suddenly. Instead, probability decay truly starts to accelerate beyond the $75 price point.
As such, the smart play may be to target the $75 strike price in a vertical options spread, then sell the portion of the risk curve above $75 to discount the net long exposure.
Considering the Smart Wager
Based on the market intelligence above, the trade that arguably makes the most sense is the 67.50/75.00 bull call spread expiring Feb. 20, 2026. For this transaction to be fully successful, MCHP stock must rise through the $75 strike price at expiration. If it does this, the maximum payout would stand at over 117%. Further, breakeven lands at $70.95, making the above trade more palatable.
From analyzing risk topography, the coalescing of activity between $66 and $70 would suggest that this range represents the most likely zone for upside success. But because there is also projected to be heightened activity around $74 to $76, selecting a capped-risk, capped-reward trade with a lower strike could expose you to a rather hefty opportunity cost.
Indeed, the rate of probability decay is what ultimately wins me over. Between $70 and $75, probability density declines by 21.75%. Between $75 and $80, density plunges by 91.4%. In other words, there’s much less chance of absorbing an opportunity cost beyond $75, making this strike an ideal upside target.
On the date of publication, Josh Enomoto did not have (either directly or indirectly) positions in any of the securities mentioned in this article. All information and data in this article is solely for informational purposes. For more information please view the Barchart Disclosure Policy here.
More news from Barchart
- Risk Topography Signals a Contrarian Opportunity for Microchip (MCHP) Stock Options
- A Less-Costly Way to Buy Costco to Gain Leveraged Upside in COST Stock
- Micron Technology Bear Put Spread Could Return 197% in this Down Move
- Costco Has Tumbled Despite Higher FCF and FCF Margins - Time to Buy COST Stock?


