Building products installation services company Installed Building Products (NYSE: IBP) reported Q3 2026 results beating Wall Street’s revenue expectations, with revenue up 3.9% year on year to $808.4 million. Its non-GAAP profit of $2.76 per share was 2.5% below analysts’ consensus estimates.
For more on Installed Building Products, read our free full research report.
Installed Building Products (IBP) Q3 2026 highlights:
- Revenue $808.4 million vs S&P analysts’ consensus estimates of $789.5 million (3.9% year-on-year growth, 2.4% beat)
- Adjusted EPS $2.76 vs S&P analysts’ consensus estimates of $2.83 (2.5% miss)
- Adjusted EBITDA $128.3 million vs analysts’ consensus estimates of $131.5 million (15.9% margin, 2.4% miss)
- Operating margin 11.3%, down from 13.7% in the same quarter last year
- Free cash flow margin 7.2%, down from 13.5% in the same quarter last year
- Market capitalization $6.22 billion
Revenue growth
Examining a company’s long-term performance can provide clues about its quality. Even a bad business can perform well for one or two quarters, but a top-tier one grows for years. Installed Building Products’s revenue grew at a solid 9.8% compounded annual growth rate over the last five years. Its growth beat the average industrials company and shows its offerings resonate with customers.
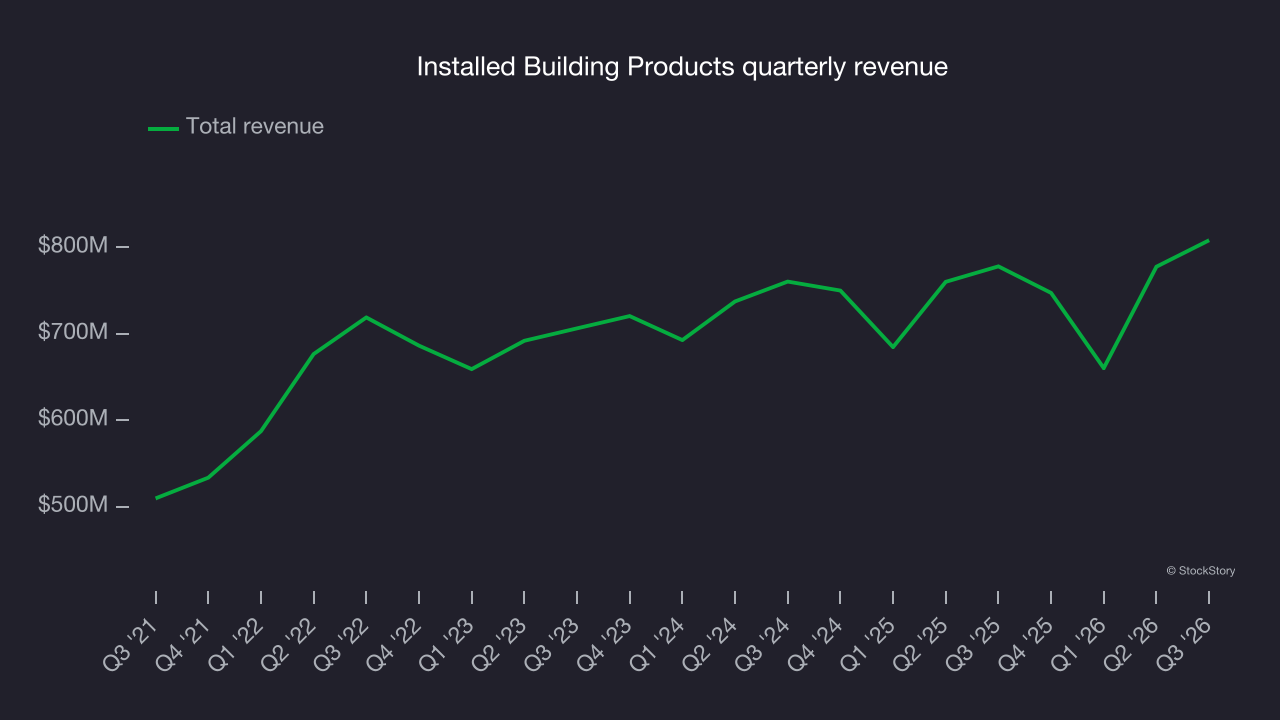
Long-term growth is the most important, but within industrials, a half-decade historical view may miss new industry trends or demand cycles. Installed Building Products’s recent performance shows its demand has slowed as its annualized revenue growth of 1.4% over the last two years was below its five-year trend. Decelerating revenue growth in the sector warrants caution, as it could signal changing consumer tastes aided by low switching costs. Many other homebuilding businesses have also faced declining revenue because of cyclical headwinds. Installed Building Products’s growth was underwhelming, but it still outpaced its peers. 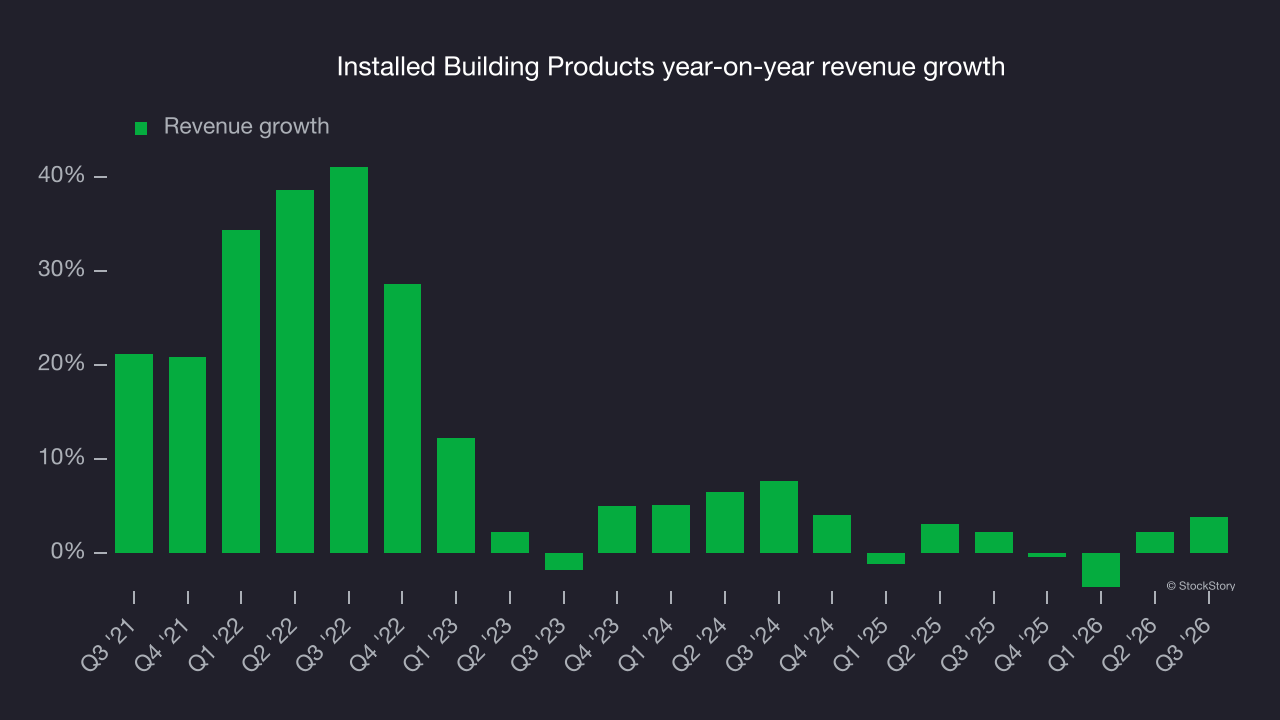
This quarter, Installed Building Products reported modest year-on-year revenue growth of 3.9% but beat Wall Street’s consensus estimates by 2.4%.
Looking ahead, sell-side analysts expect revenue to grow 1.7% over the next 12 months, according to S&P, similar to its two-year rate. This projection is underwhelming and implies its newer products and services will not accelerate its top-line performance yet.
Operating margin
Operating margin is a key measure of profitability. Think of it as net income - the bottom line - excluding the impact of taxes and interest on debt, which are less connected to business fundamentals.
Installed Building Products’s operating margin has more or less stayed the same over the last 12 months, averaging 12.6% over the last five years. This profitability was high for an industrials business, showing it’s a well-run company with an efficient cost structure.
Installed Building Products’s operating margin has fluctuated slightly but generally stayed the same over the last five years. Margin expansion would be preferable, but its performance was still solid, especially considering the unfavorable turn in the cycle and the declines in revenue and margins at most peers.
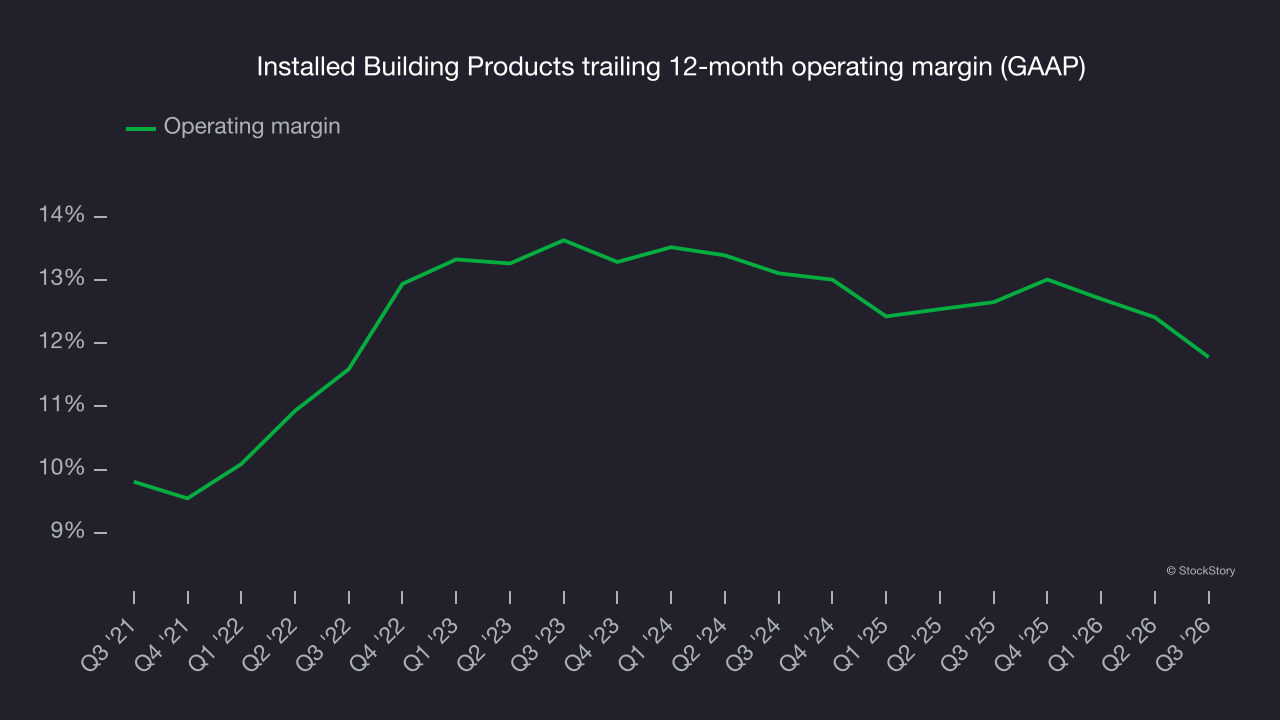
This quarter, Installed Building Products generated an operating margin of 11.3%, down 2.4 percentage points year on year. Its operating margin decreased more than its gross margin, suggesting lower efficiency as expenses such as marketing, research and development and administrative overhead increased.
Earnings per share
We track the long-term change in earnings per share, or EPS, for the same reason as long-term revenue growth. Compared to revenue, however, EPS highlights whether a company’s growth is profitable.
Installed Building Products’s EPS grew at a 15.5% compounded annual growth rate over the last five years, higher than its 9.8% annualized revenue growth. However, this alone doesn’t tell us much about its business quality because its operating margin didn’t improve.
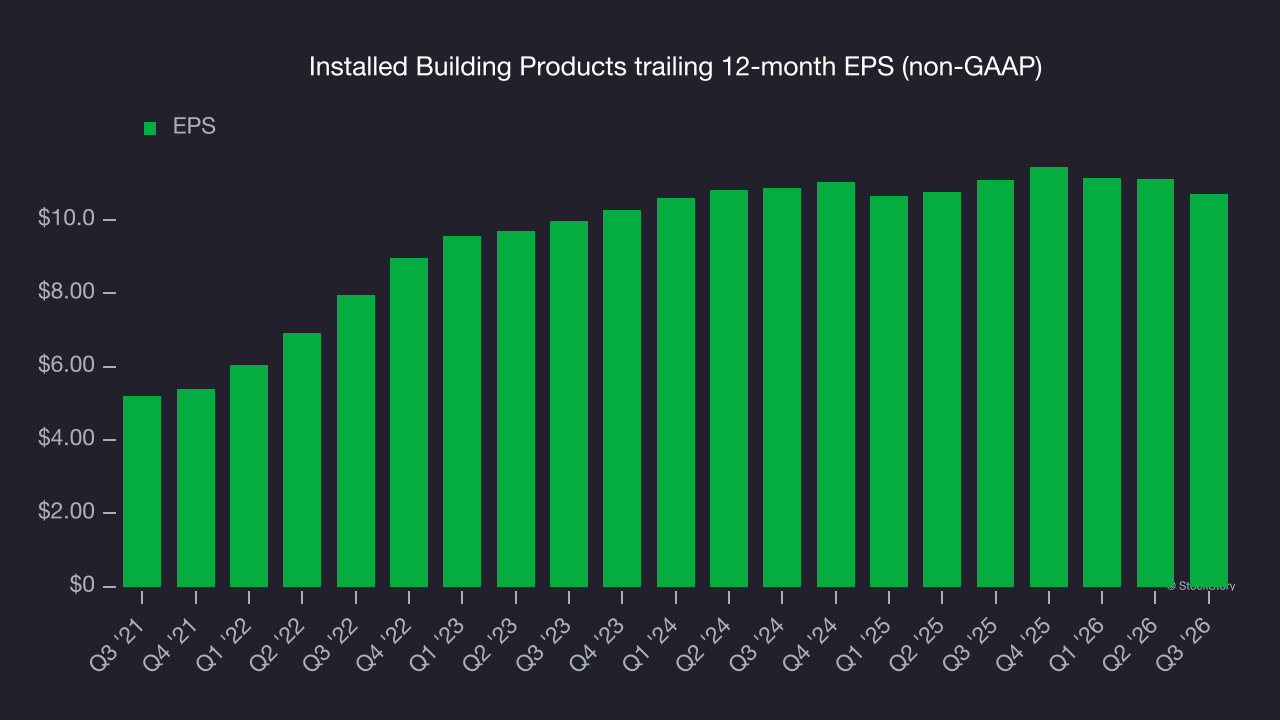
Examining Installed Building Products’s quality of earnings can give us a better understanding of its performance. A five-year view shows that Installed Building Products has repurchased its stock, shrinking its share count by 10.5%. This tells us its EPS outperformed its revenue not because of increased operational efficiency but financial engineering, as buybacks boost per share earnings. 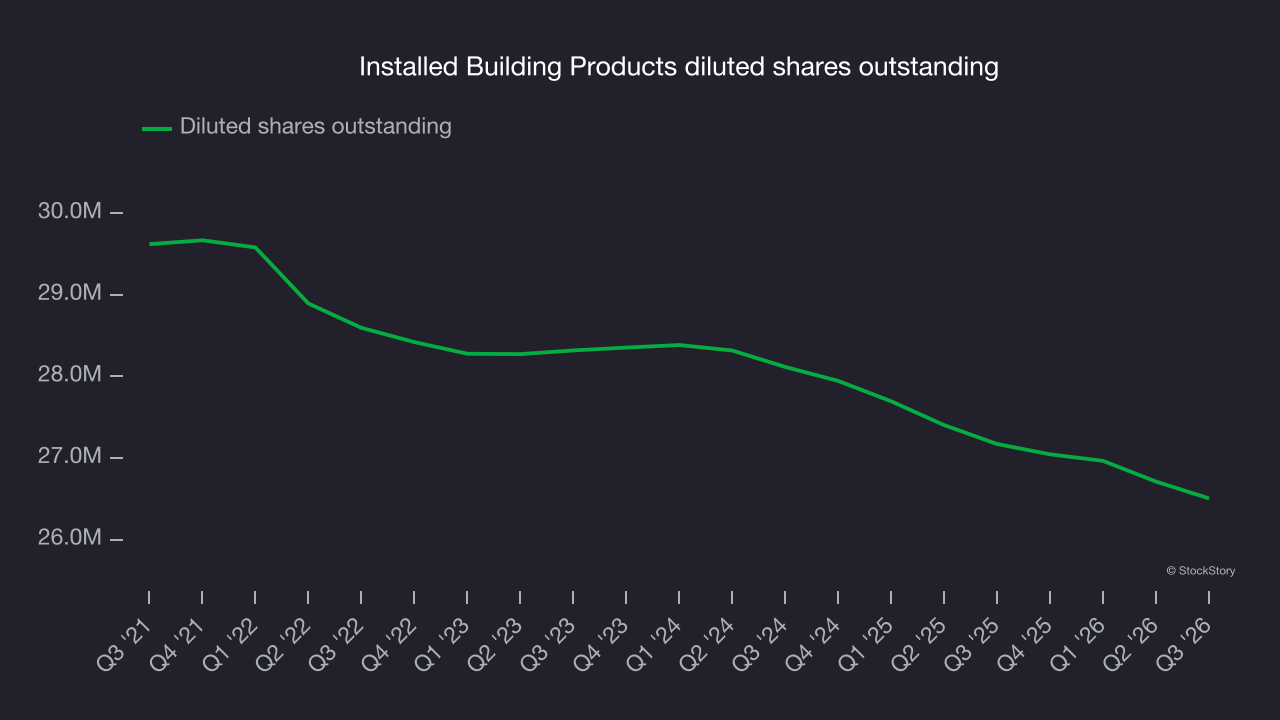
As with revenue, we analyze EPS over a more recent period because it can provide insight into an emerging theme or development for the business.
For Installed Building Products, EPS was unchanged over the last two years, a regression from its five-year trend. A return to earnings growth in the coming years would be an improvement.
In Q3, Installed Building Products reported adjusted EPS of $2.76, down from $3.18 in the same quarter last year. This result missed analysts’ consensus estimates, but long-term adjusted EPS growth matters more than short-term movements. Over the next 12 months, Wall Street expects Installed Building Products’s full-year EPS to shrink by 1.2% from $10.70 to $10.57, according to S&P.
Key takeaways from Installed Building Products’s Q3 results
Installed Building Products’ revenue beat analysts’ consensus estimates, but earnings fell short: Both EPS and EBITDA missed Wall Street’s expectations. That made for a softer Q3 overall. Shares fell 3.1% to $228.07 immediately after the report.
Is Installed Building Products a buy at its current price? The latest quarter matters, but not nearly as much as longer-term fundamentals and valuation when deciding if the stock is a buy. Read our full research report here (it’s free).