Agentic operations company Genpact (NYSE: G) reported Q3 2026 results beating Wall Street’s revenue expectations, with revenue up 7.3% year on year to $1.39 billion. Its non-GAAP profit of $1.07 per share was 2.5% above analysts’ consensus estimates.
For more on Genpact, read our full research report, available free.
Genpact (G) Q3 2026 highlights:
- Revenue $1.39 billion vs S&P analysts’ consensus estimates of $1.38 billion (7.3% year-on-year growth, 0.6% beat)
- Adjusted EPS $1.07 vs S&P analysts’ consensus estimates of $1.04 (2.5% beat)
- Adjusted operating income $246.5 million vs analysts’ consensus estimates of $244.9 million (17.8% margin, 0.7% beat)
- Adjusted EPS guidance $4.14 at the midpoint for the full year, roughly in line with what analysts were expecting
- Operating margin 15.2%, in line with the same quarter last year
- Constant currency revenue rose 7.5% year on year (6% in the same quarter last year)
- Market capitalization $6.85 billion
Revenue growth
A company’s long-term revenue performance is one signal of its overall quality. Even a bad business can perform well for one or two quarters, but a top-tier one grows for years.
With $5.34 billion in revenue over the past 12 months, Genpact is one of the larger companies in the business services industry and benefits from a well-known brand that influences purchasing decisions.
Genpact’s revenue grew at a decent 6.5% compounded annual growth rate over the last five years. This shows its offerings generated slightly more demand than the average business services company.
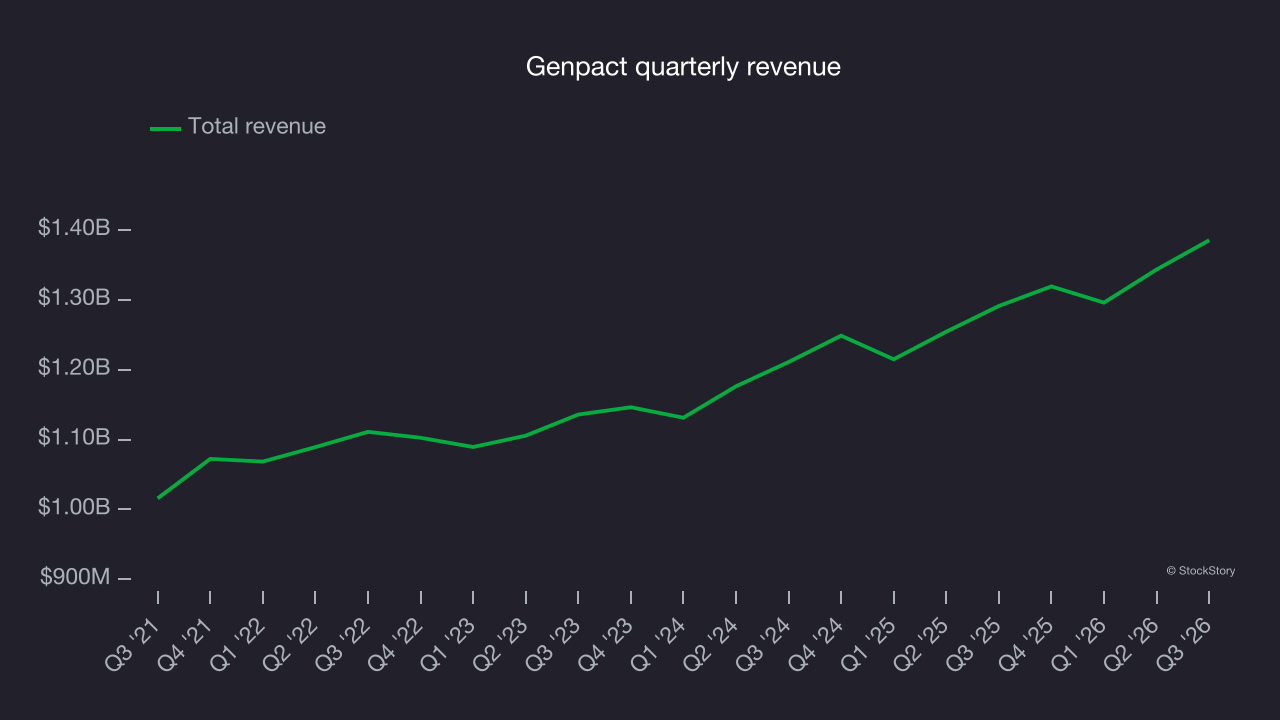
Long-term growth is the most important, but within business services, a half-decade historical view may miss new innovations or demand cycles. Genpact’s annualized revenue growth of 7% over the last two years aligns with its five-year trend, suggesting its demand was stable.
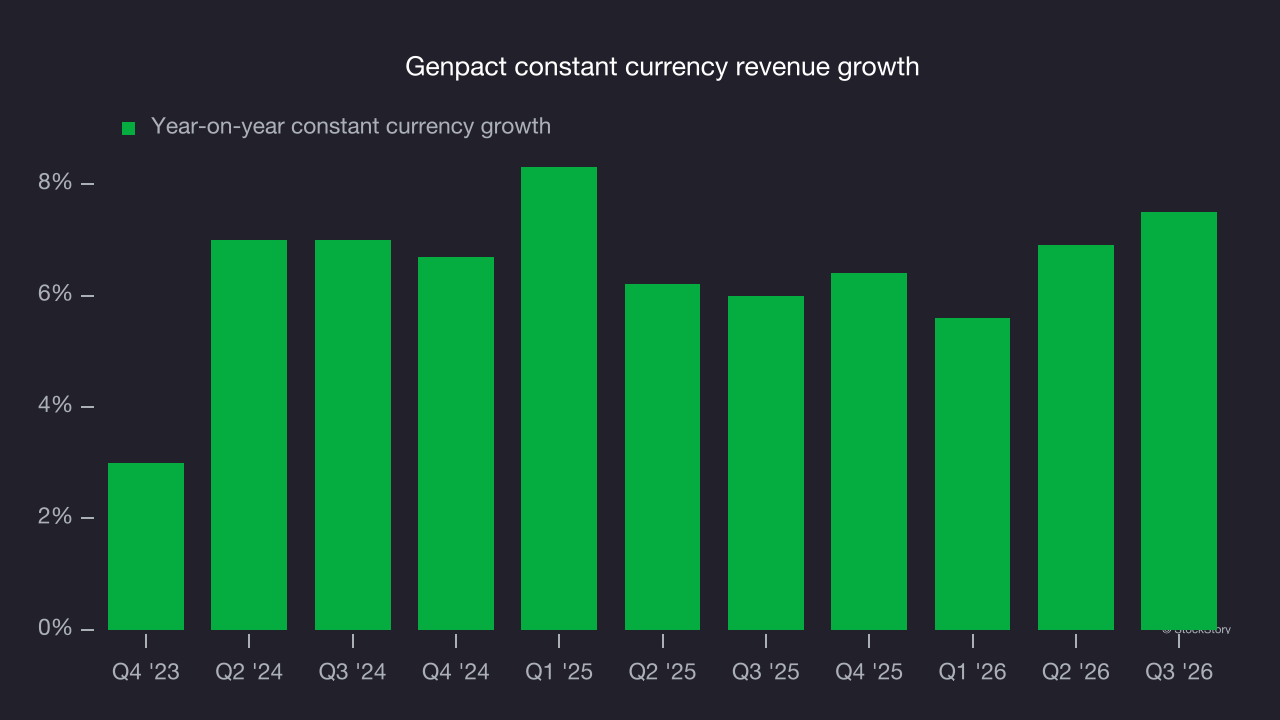
Analyzing the company’s constant currency revenue helps explain its revenue dynamics by excluding currency movements that are outside its control and not indicative of demand. Over the last two years, its constant currency revenue averaged 6.7% year-on-year growth. That was in line with reported revenue growth, indicating that foreign exchange has not had a meaningful impact on revenue.
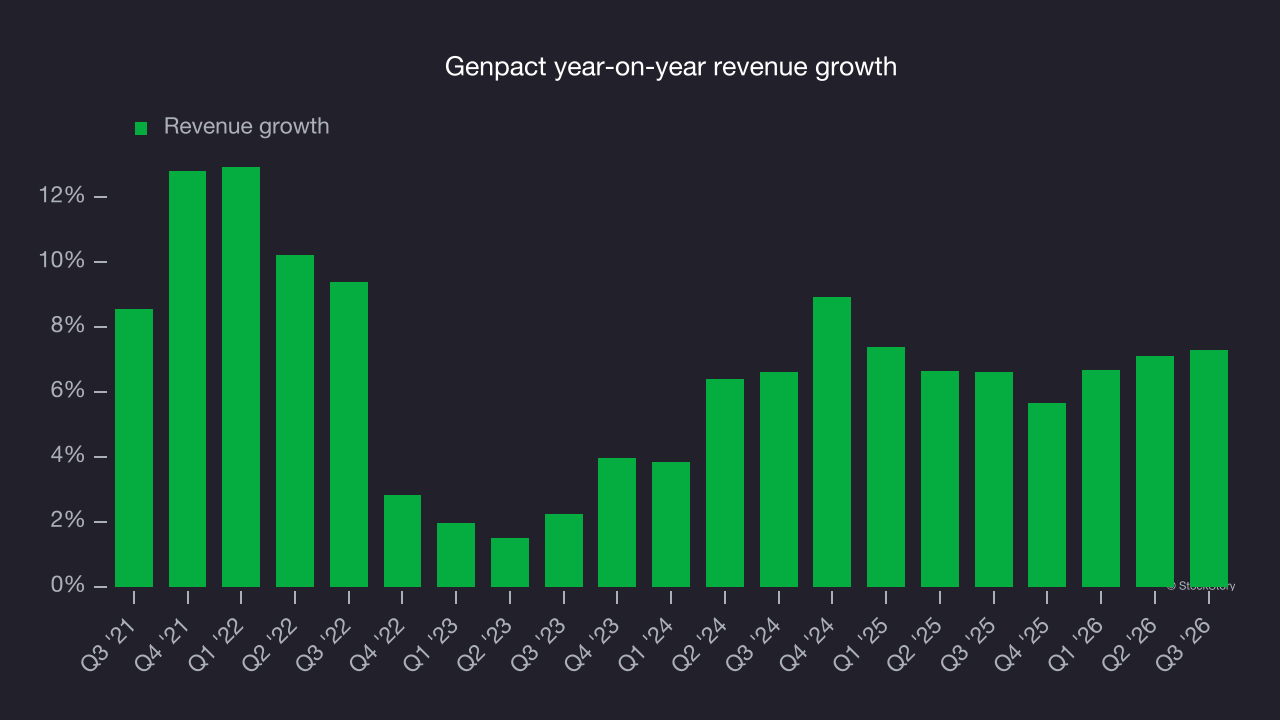
This quarter, Genpact reported year-on-year revenue growth of 7.3%, and its $1.39 billion in revenue exceeded Wall Street’s consensus estimates by 0.6%.
Looking ahead, sell-side analysts expect revenue to grow 7% over the next 12 months, according to S&P, similar to its two-year rate. That favorable outlook implies the market expects success for its products and services.
Adjusted operating margin
Genpact has been an efficient company over the last five years. It was one of the more profitable businesses in the business services sector, with an average adjusted operating margin of 17%.
Looking at the trend in its profitability, Genpact’s adjusted operating margin rose by 1.7 percentage points over the last five years, as its revenue growth gave it operating leverage.
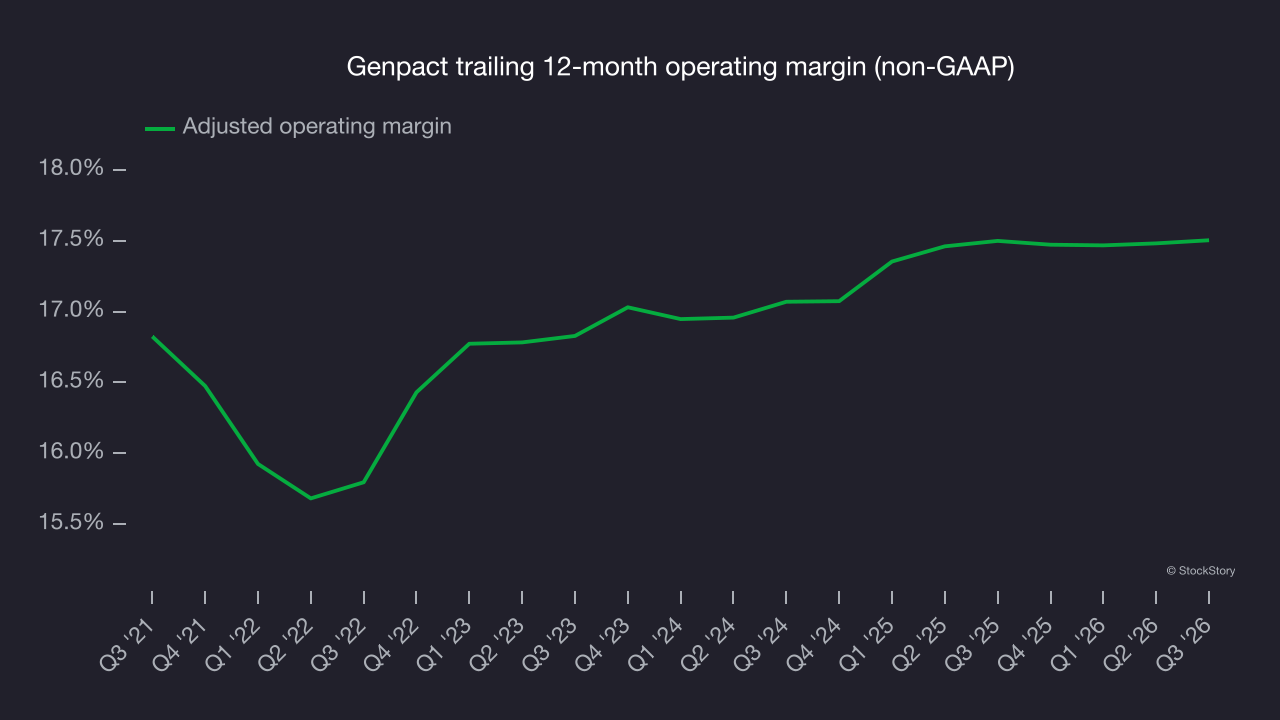
In Q3, Genpact generated an adjusted operating margin of 17.8%, in line with the same quarter last year. This indicates the company’s overall cost structure has been relatively stable.
Earnings per share
Revenue trends explain a company’s historical growth, but the long-term change in earnings per share, or EPS, points to the profitability of that growth. For example, a company could inflate its revenue through excessive spending on advertising and promotions.
Genpact’s EPS grew at a 10.7% compounded annual growth rate over the last five years, higher than its 6.5% annualized revenue growth. This indicates the company became more profitable on a per-share basis as it expanded.
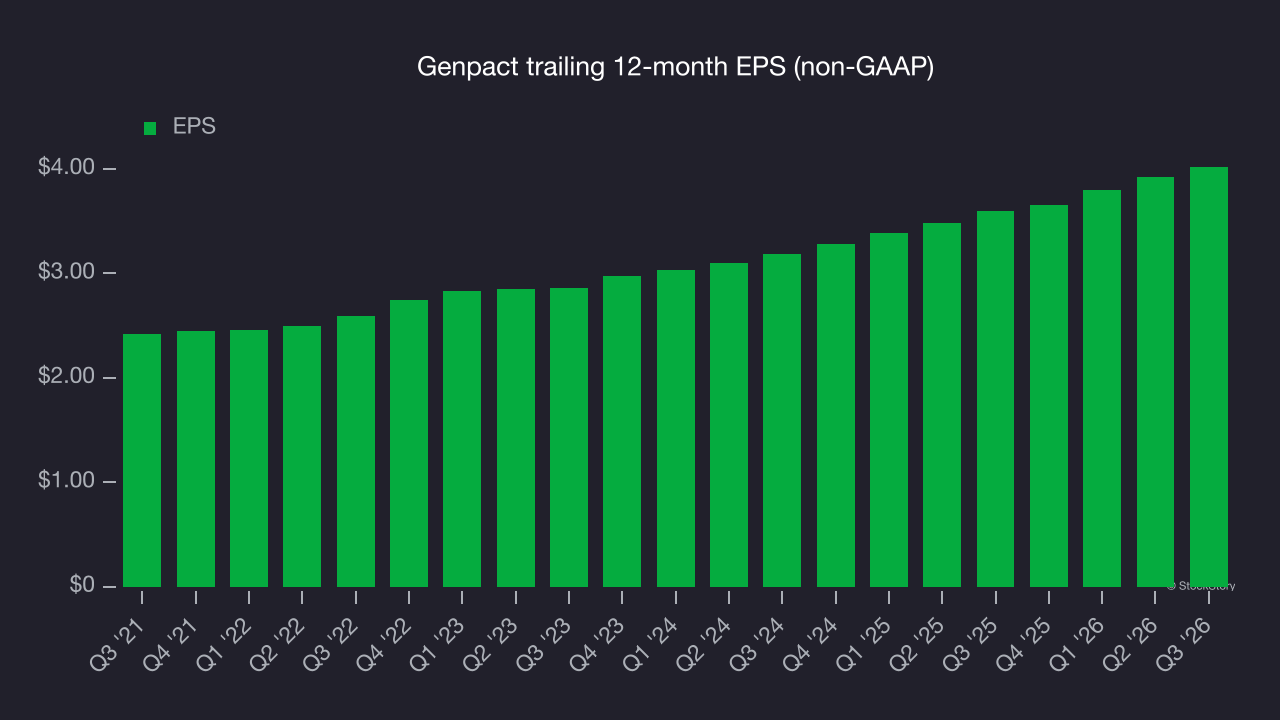
A closer look at Genpact’s earnings can help explain its performance. As mentioned earlier, Genpact’s adjusted operating margin was flat this quarter but expanded by 1.7 percentage points over the last five years. On top of that, its share count shrank by 12.2%. These are positive signs for shareholders because improving profitability and share buybacks boost EPS growth relative to revenue growth.
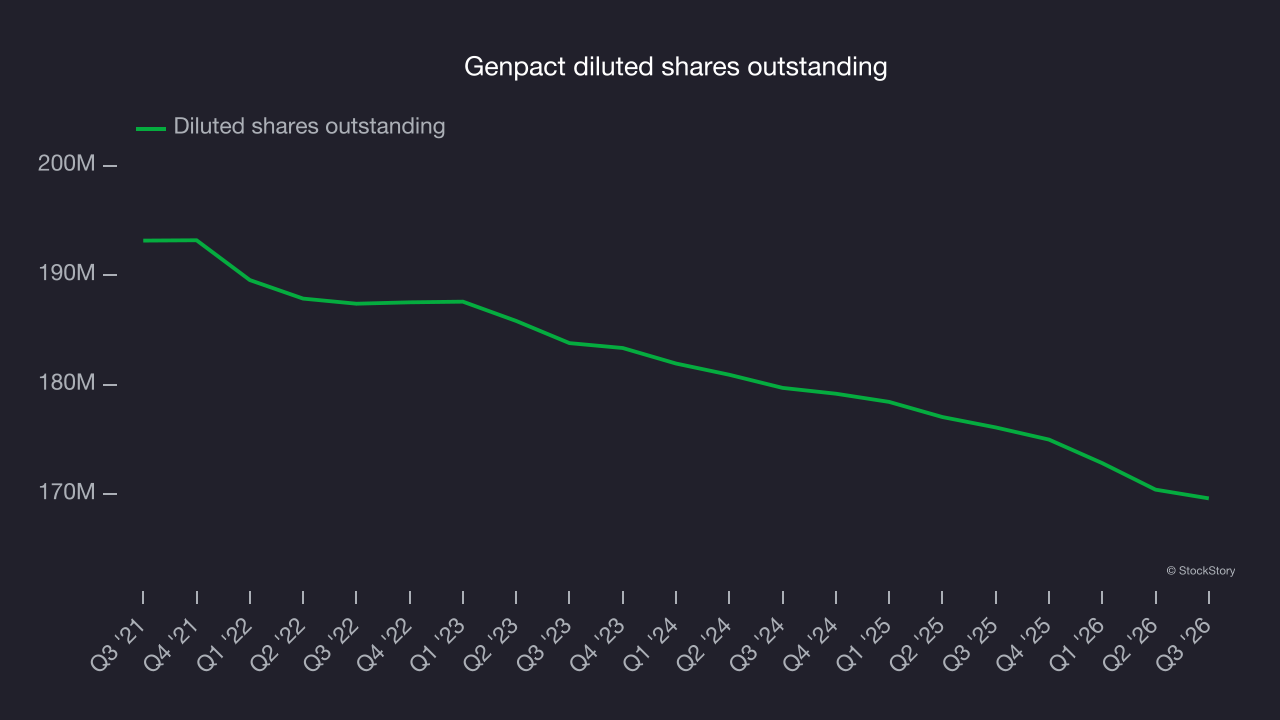
As with revenue, we analyze EPS over a more recent period because it can provide insight into an emerging theme or development for the business.
For Genpact, its two-year annual EPS growth of 12.3% was higher than its five-year trend. That acceleration is a positive sign, particularly given the already high base.
In Q3, Genpact reported adjusted EPS of $1.07, up from $0.97 in the same quarter last year. This result beat analysts’ consensus estimates by 2.5%. Over the next 12 months, Wall Street expects Genpact’s full-year EPS to grow 9.3% from $4.02 to $4.39, according to S&P.
Key takeaways from Genpact’s Q3 results
Genpact’s Q3 results had some key positives: EPS beat analysts’ consensus estimates, and revenue came in narrowly ahead of Wall Street’s consensus. Still, investors were likely hoping for more. Shares fell 2.1% to $40.26 immediately after the results.
The latest quarter is only one part of assessing longer-term business quality. Quality, combined with valuation, can help determine whether the stock is a buy. For more on those factors, read the full research report here (it’s free).