Rigid packaging solutions manufacturer Silgan Holdings (NYSE: SLGN) missed Wall Street’s revenue expectations in Q3 2026 as revenue rose just 1.6% year on year to $2.04 billion. Its non-GAAP profit of $1.31 per share was 4.9% above analysts’ consensus estimates.
For more on Silgan Holdings, read our free full research report.
Silgan Holdings (SLGN) Q3 2026 highlights:
- Revenue $2.04 billion vs S&P analysts’ consensus estimates of $2.09 billion (1.6% year-on-year growth, 2.4% miss)
- Adjusted EPS $1.31 vs S&P analysts’ consensus estimates of $1.25 (4.9% beat)
- Adjusted EPS guidance Management raised its full-year adjusted EPS guidance to $3.88 at the midpoint, a 1.3% increase
- Operating margin 9.4%, in line with the same quarter last year
- Free cash flow margin 13%, similar to the same quarter last year
- Market capitalization $4.01 billion
"As Silgan embarks upon the next chapter in our value creation journey through our recently announced portfolio transformation, we remain steadfast in our commitment to compete and win in the markets we serve by meeting the unique needs of our customers and being the best at what we do. As a result, we believe we are uniquely positioned to outperform the markets we serve and grow our strategic partnerships with new and existing customers,” said Adam Greenlee, President and CEO. “As we begin to reposition our segments and align to the unique priorities we have defined for each business, we believe our Company is poised to create meaningful value for shareholders as a result of our disciplined capital deployment model and intense focus on execution.”
Revenue growth
A company’s long-term revenue performance is one signal of its overall quality. Any business can experience short-term success, but top-performing ones sustain growth for years. Silgan Holdings’s revenue grew at a sluggish 4.2% annualized rate over the last five years, falling short of the industrials sector standard.
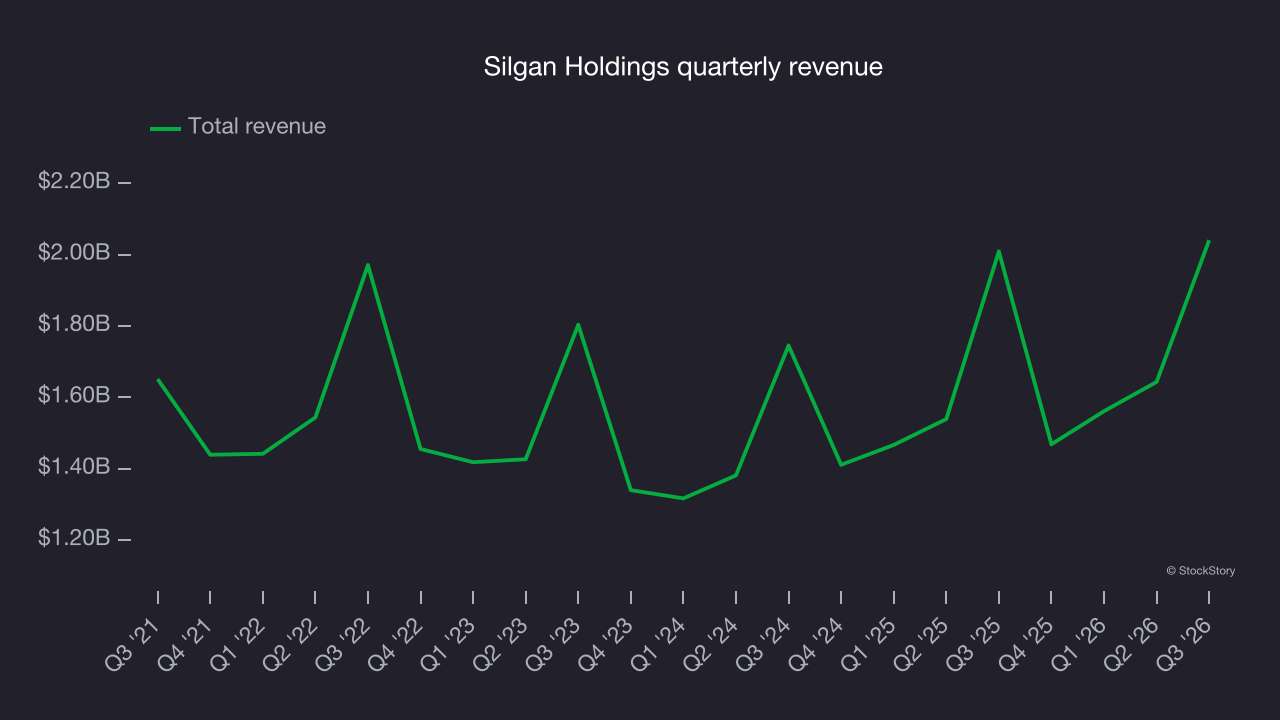
Long-term growth is the most important, but within industrials, a half-decade historical view may miss new industry trends or demand cycles. Silgan Holdings’s annualized revenue growth of 7.7% over the last two years is above its five-year trend, suggesting some bright spots. 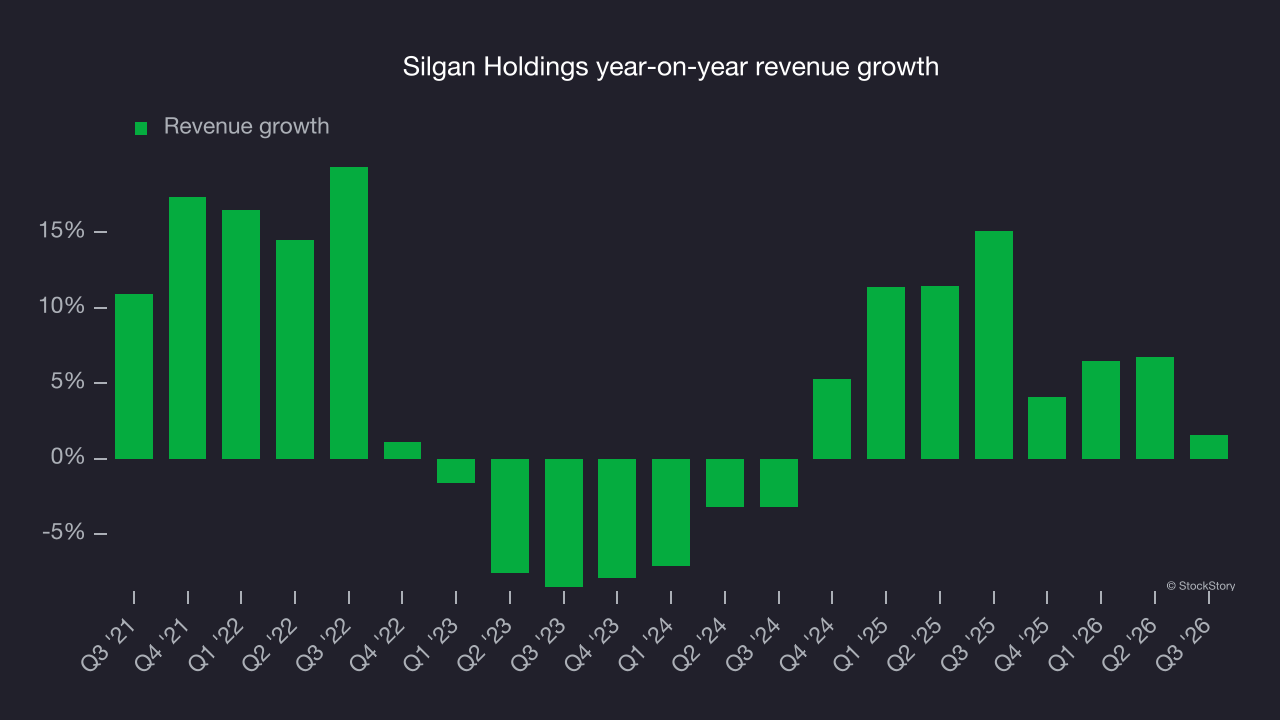
This quarter, Silgan Holdings’s revenue grew by 1.6% year on year to $2.04 billion, falling short of Wall Street’s consensus estimates.
Looking ahead, sell-side analysts expect revenue to grow 3.4% over the next 12 months, according to S&P, a deceleration versus the last two years. This underwhelming projection indicates its products and services will face some demand challenges.
Operating margin
Operating margin is an important measure of profitability as it shows the portion of revenue left after accounting for all core expenses, from the cost of goods sold to advertising and wages. It’s also useful for comparing profitability across companies with different levels of debt and tax rates because it excludes interest and taxes.
Silgan Holdings has done a decent job managing its cost base over the last five years. The company has produced an average operating margin of 9.3%, higher than the broader industrials sector.
Analyzing the trend in its profitability, Silgan Holdings’s operating margin decreased by 1.7 percentage points over the last five years. This raises questions about the company’s expense base because its revenue growth should have given it leverage on its fixed costs, resulting in better economies of scale and profitability.
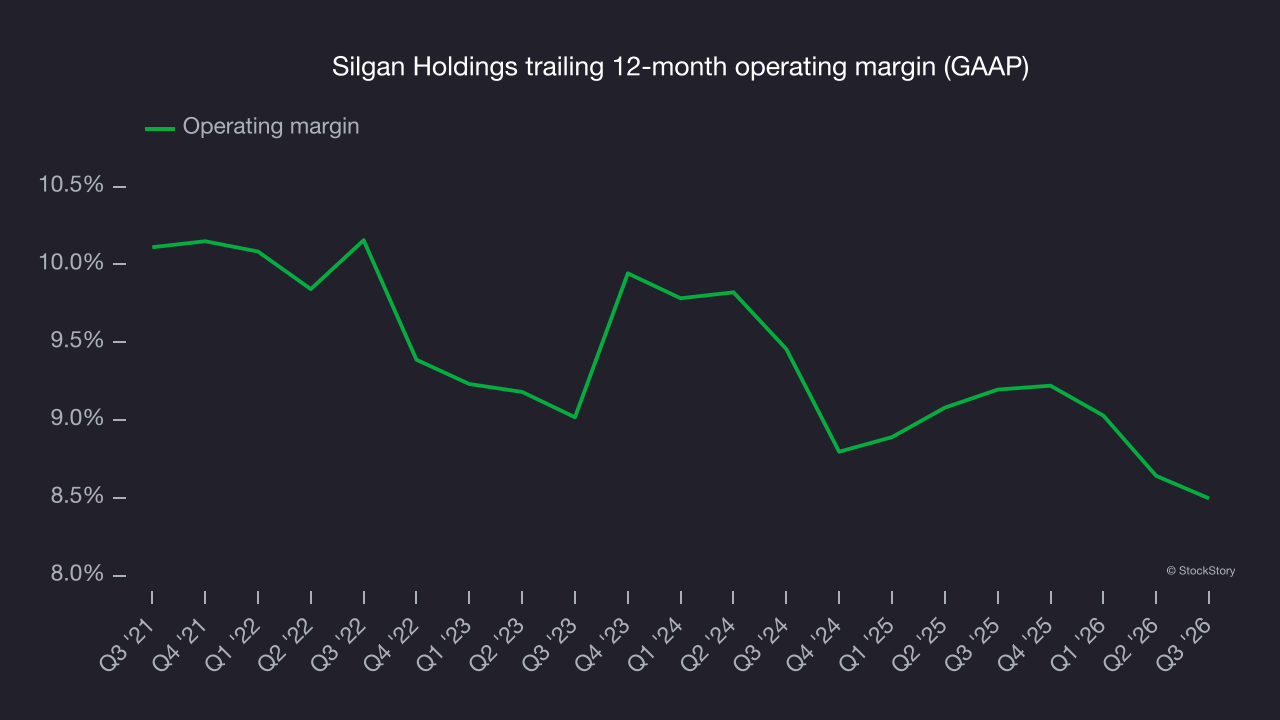
This quarter, Silgan Holdings generated an operating margin of 9.4%, in line with the same quarter last year. This indicates the company’s cost structure has recently been stable.
Earnings per share
We track the long-term change in earnings per share (EPS) for the same reason as long-term revenue growth. Compared to revenue, however, EPS highlights whether a company’s growth is profitable.
Silgan Holdings’s weak 3% annual EPS growth over the last five years aligns with its revenue performance. This indicates it maintained its per-share profitability as it expanded.
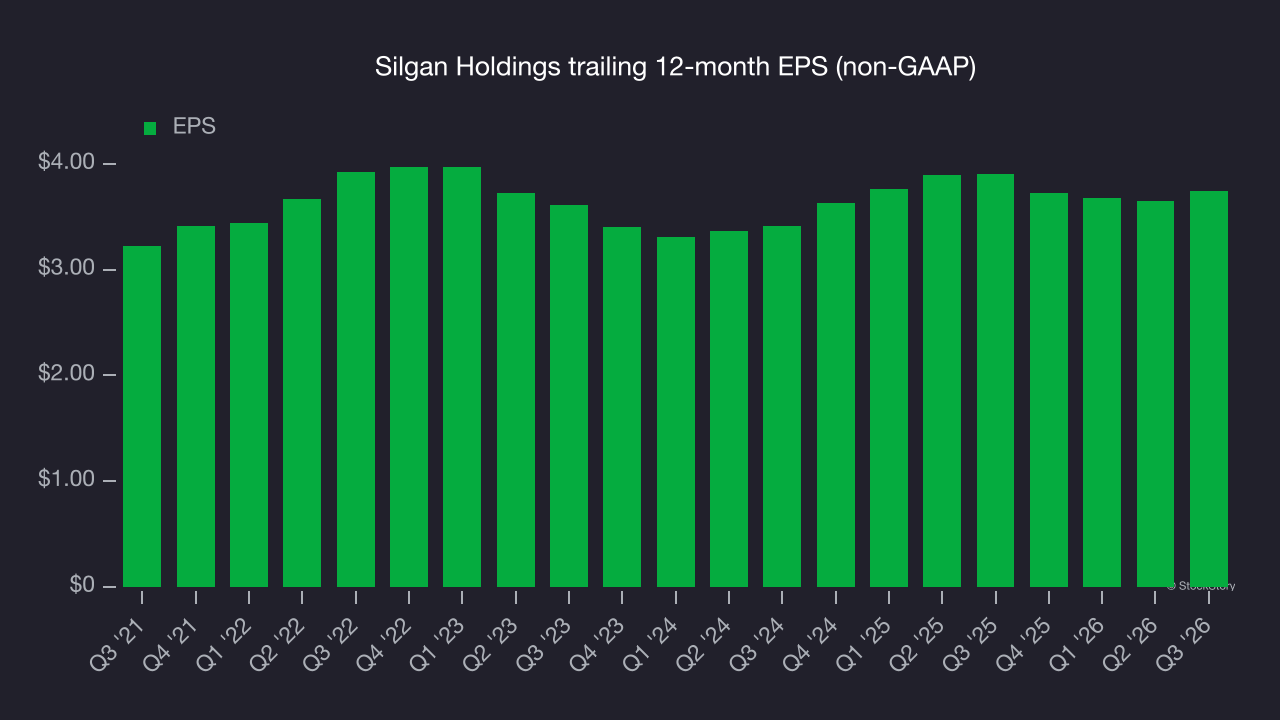
As with revenue, we analyze EPS over a more recent period because it can provide insight into an emerging theme or development for the business.
For Silgan Holdings, its two-year annual EPS growth of 4.7% was higher than its five-year trend. Accelerating earnings growth is almost always a positive sign.
In Q3, Silgan Holdings reported adjusted EPS of $1.31, up from $1.22 in the same quarter last year. This result beat analysts’ consensus estimates by 4.9%. Over the next 12 months, Wall Street expects Silgan Holdings’s full-year EPS to grow 6% from $3.74 to $3.97, according to S&P.
Key takeaways from Silgan Holdings’s Q3 results
Silgan Holdings’s revenue miss tempered the positives: EPS beat Wall Street’s consensus estimates, and full-year EPS guidance also topped analysts’ consensus expectations. Overall, the quarter could have been better. Shares remained flat at $38.25 immediately after the release.
When deciding whether to buy the stock, it’s important to consider its valuation, business quality and latest quarterly results. For more, read the full research report here (it’s free).