
Server solutions provider Super Micro (NASDAQ: SMCI) missed Wall Street’s revenue expectations in Q2 CY2025, but sales rose 7.5% year on year to $5.76 billion. Next quarter’s revenue guidance of $6.5 billion underwhelmed, coming in 2.9% below analysts’ estimates. Its non-GAAP profit of $0.41 per share was 6.6% below analysts’ consensus estimates.
Is now the time to buy Super Micro? Find out by accessing our full research report, it’s free.
Super Micro (SMCI) Q2 CY2025 Highlights:
- Revenue: $5.76 billion vs analyst estimates of $6.01 billion (7.5% year-on-year growth, 4.2% miss)
- Adjusted EPS: $0.41 vs analyst expectations of $0.44 (6.6% miss)
- Adjusted EBITDA: $339 million vs analyst estimates of $369.1 million (5.9% margin, 8.1% miss)
- Revenue Guidance for Q3 CY2025 is $6.5 billion at the midpoint, below analyst estimates of $6.69 billion
- Adjusted EPS guidance for Q3 CY2025 is $0.46 at the midpoint, below analyst estimates of $0.59
- Operating Margin: 4%, down from 5.4% in the same quarter last year
- Free Cash Flow was $840.9 million, up from -$655.8 million in the same quarter last year
- Market Capitalization: $34.75 billion
Company Overview
Founded in Silicon Valley in 1993 and known for its modular "building block" approach to server design, Super Micro Computer (NASDAQ: SMCI) designs and manufactures high-performance, energy-efficient server and storage systems for data centers, cloud computing, AI, and edge computing applications.
Revenue Growth
A company’s long-term performance is an indicator of its overall quality. Even a bad business can shine for one or two quarters, but a top-tier one grows for years.
With $21.97 billion in revenue over the past 12 months, Super Micro is a behemoth in the business services sector and benefits from economies of scale, giving it an edge in distribution. This also enables it to gain more leverage on its fixed costs than smaller competitors and the flexibility to offer lower prices.
As you can see below, Super Micro’s sales grew at an incredible 45.8% compounded annual growth rate over the last five years. This is a great starting point for our analysis because it shows Super Micro’s demand was higher than many business services companies.
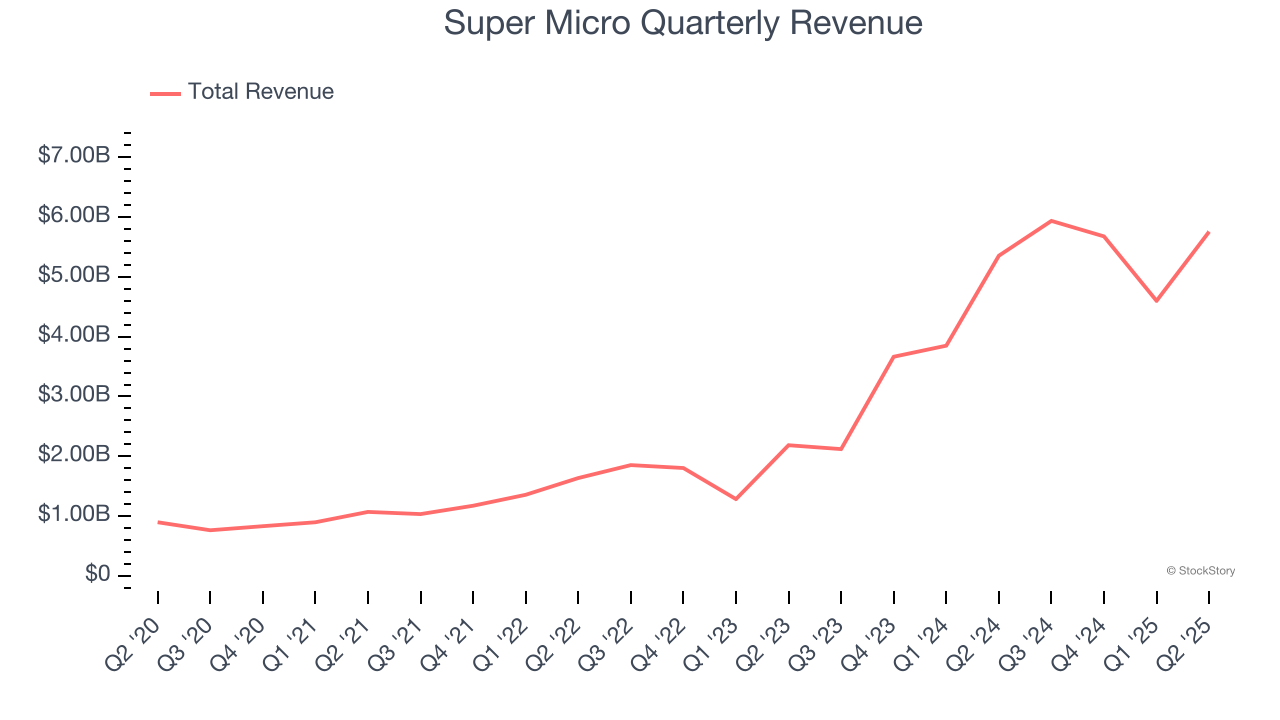
Long-term growth is the most important, but within business services, a half-decade historical view may miss new innovations or demand cycles. Super Micro’s annualized revenue growth of 75.6% over the last two years is above its five-year trend, suggesting its demand was strong and recently accelerated. 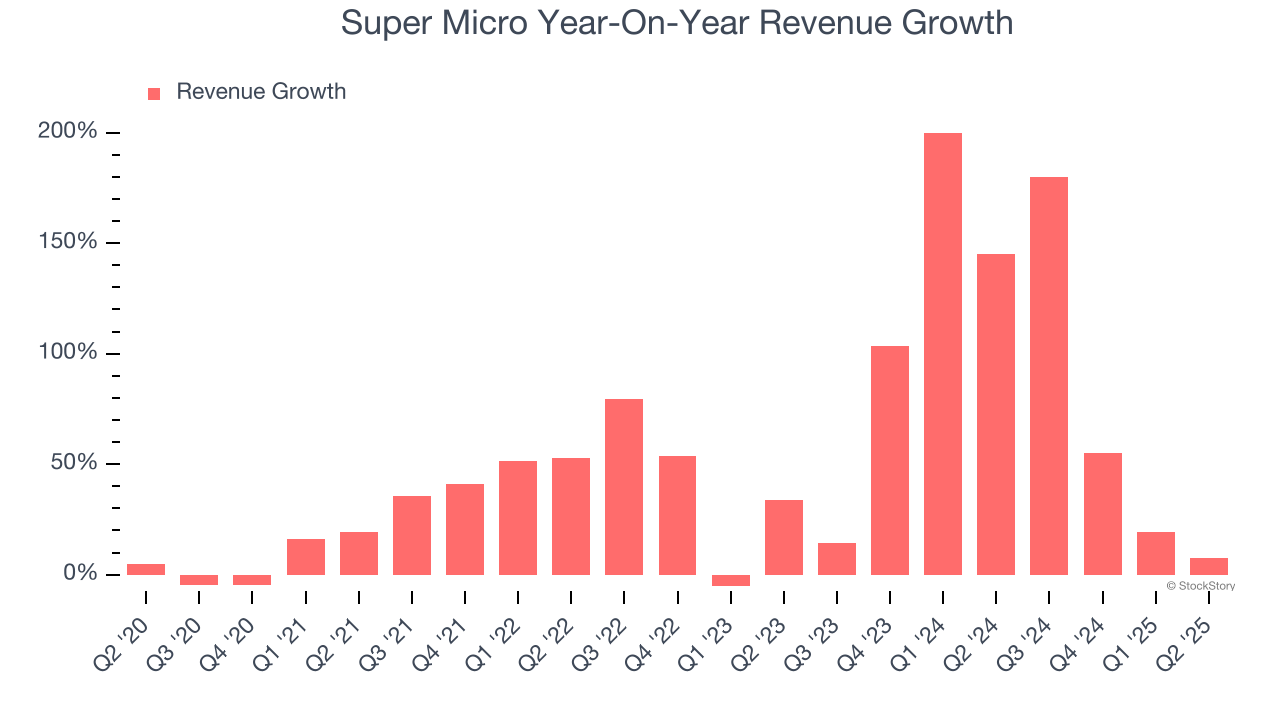
This quarter, Super Micro’s revenue grew by 7.5% year on year to $5.76 billion, missing Wall Street’s estimates. Company management is currently guiding for a 9.5% year-on-year increase in sales next quarter.
Looking further ahead, sell-side analysts expect revenue to grow 34.5% over the next 12 months, a deceleration versus the last two years. Still, this projection is eye-popping given its scale and implies the market is baking in success for its products and services.
Here at StockStory, we certainly understand the potential of thematic investing. Diverse winners from Microsoft (MSFT) to Alphabet (GOOG), Coca-Cola (KO) to Monster Beverage (MNST) could all have been identified as promising growth stories with a megatrend driving the growth. So, in that spirit, we’ve identified a relatively under-the-radar profitable growth stock benefiting from the rise of AI, available to you FREE via this link.
Operating Margin
Operating margin is one of the best measures of profitability because it tells us how much money a company takes home after subtracting all core expenses, like marketing and R&D.
Super Micro was profitable over the last five years but held back by its large cost base. Its average operating margin of 7% was weak for a business services business.
On the plus side, Super Micro’s operating margin rose by 2.2 percentage points over the last five years, as its sales growth gave it operating leverage.
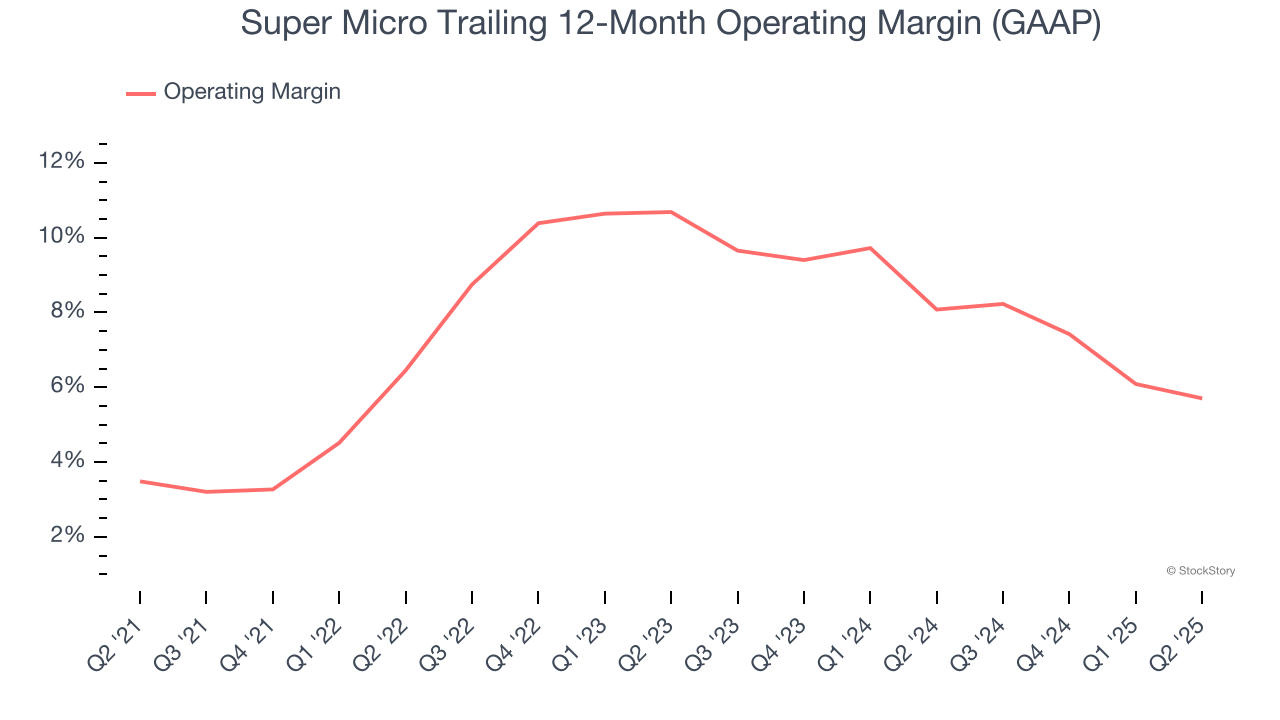
This quarter, Super Micro generated an operating margin profit margin of 4%, down 1.4 percentage points year on year. This reduction is quite minuscule and indicates the company’s overall cost structure has been relatively stable.
Earnings Per Share
Revenue trends explain a company’s historical growth, but the long-term change in earnings per share (EPS) points to the profitability of that growth – for example, a company could inflate its sales through excessive spending on advertising and promotions.
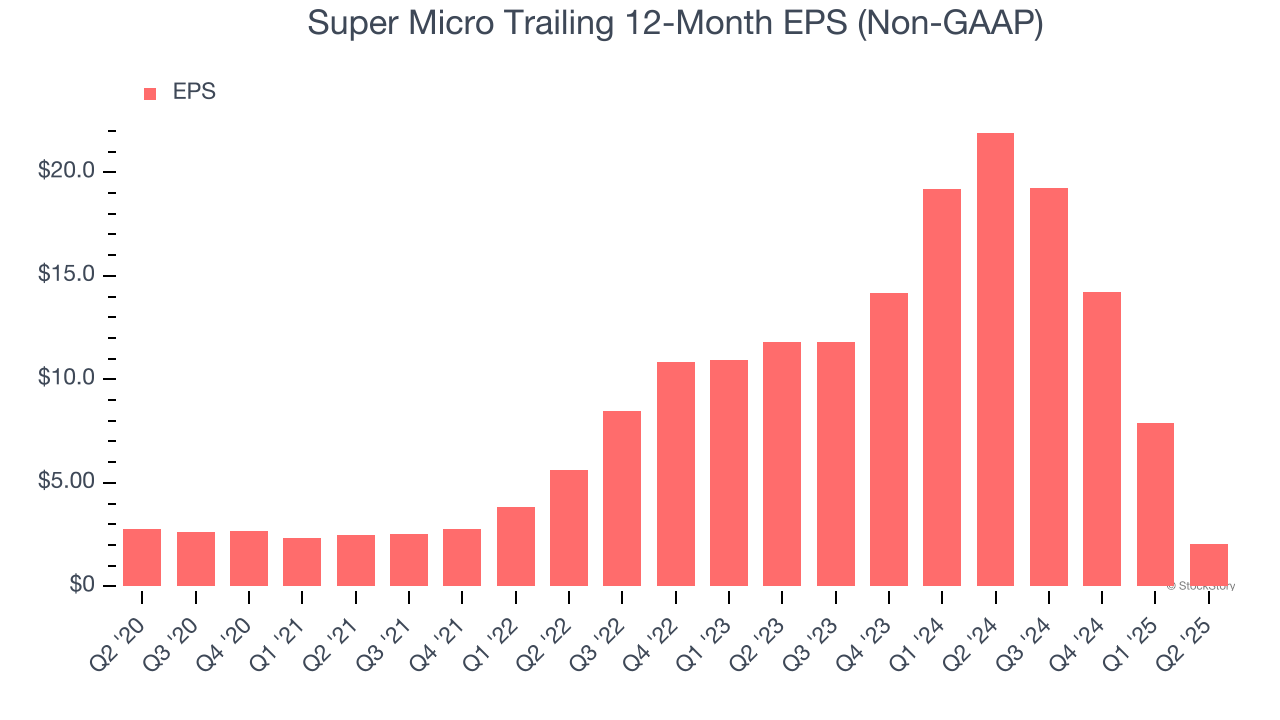
Sadly for Super Micro, its EPS declined by 5.7% annually over the last five years while its revenue grew by 45.8%. However, its operating margin actually improved during this time, telling us that non-fundamental factors such as interest expenses and taxes affected its ultimate earnings.
We can take a deeper look into Super Micro’s earnings to better understand the drivers of its performance. A five-year view shows Super Micro has diluted its shareholders, growing its share count by 15.2%. This dilution overshadowed its increased operating efficiency and has led to lower per share earnings. Taxes and interest expenses can also affect EPS but don’t tell us as much about a company’s fundamentals. 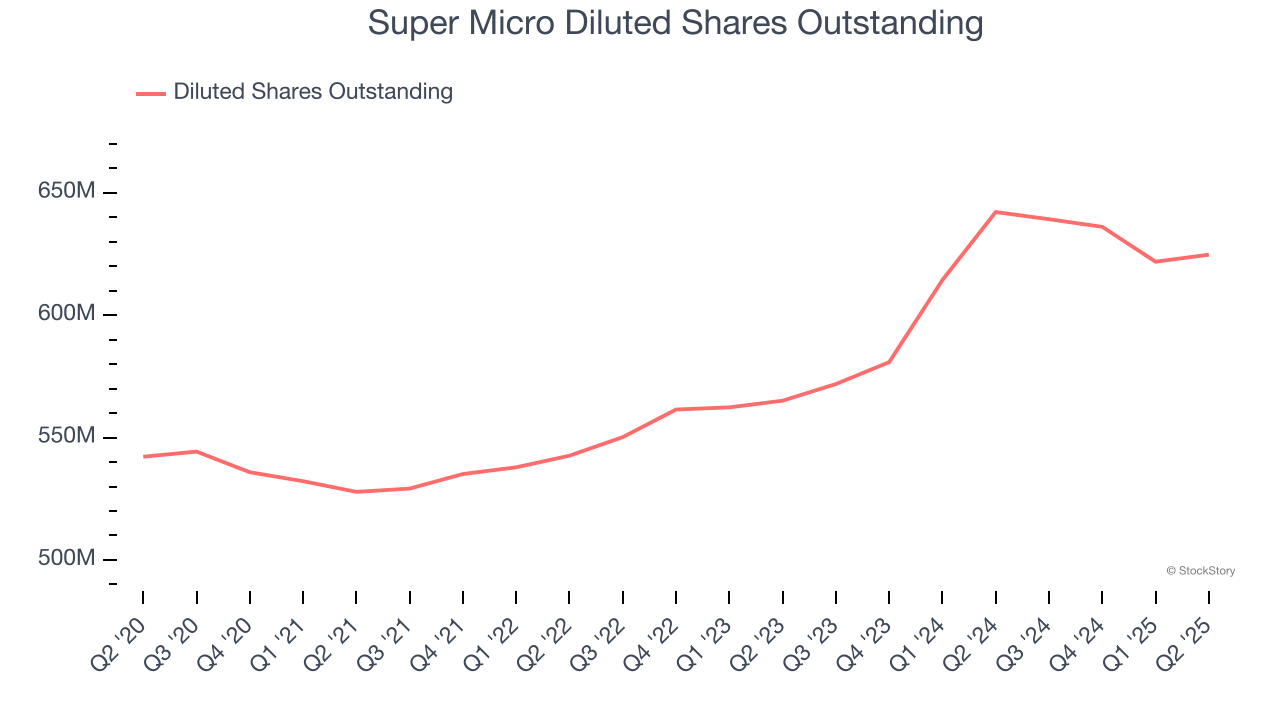
Like with revenue, we analyze EPS over a shorter period to see if we are missing a change in the business.
For Super Micro, its two-year annual EPS declines of 58.2% show it’s continued to underperform. These results were bad no matter how you slice the data, but given it was successful in other measures of financial health, we’re hopeful Super Micro can generate earnings growth in the future.
In Q2, Super Micro reported adjusted EPS at $0.41, down from $6.25 in the same quarter last year. This print missed analysts’ estimates. Over the next 12 months, Wall Street expects Super Micro’s full-year EPS of $2.06 to grow 34.8%.
Key Takeaways from Super Micro’s Q2 Results
It was tough to see SMCI miss analysts’ revenue, EPS, and EBITDA estimates. We were also disappointed it guided below expectations for next quarter's revenue and EPS. Overall, this was a weaker quarter. The stock traded down 15.7% to $48.32 immediately following the results.
The latest quarter from Super Micro’s wasn’t that good. One earnings report doesn’t define a company’s quality, though, so let’s explore whether the stock is a buy at the current price. When making that decision, it’s important to consider its valuation, business qualities, as well as what has happened in the latest quarter. We cover that in our actionable full research report which you can read here, it’s free.


