
Industrial supplier Fastenal (NASDAQ: FAST) reported revenue ahead of Wall Street’s expectations in Q2 CY2025, with sales up 8.6% year on year to $2.08 billion. Its GAAP profit of $0.29 per share was 3.7% above analysts’ consensus estimates.
Is now the time to buy Fastenal? Find out by accessing our full research report, it’s free.
Fastenal (FAST) Q2 CY2025 Highlights:
- Revenue: $2.08 billion vs analyst estimates of $2.07 billion (8.6% year-on-year growth, 0.5% beat)
- EPS (GAAP): $0.29 vs analyst estimates of $0.28 (3.7% beat)
- Adjusted EBITDA: $480.5 million vs analyst estimates of $474.3 million (23.1% margin, 1.3% beat)
- Operating Margin: 21%, in line with the same quarter last year
- Free Cash Flow Margin: 10.1%, similar to the same quarter last year
- Sales Volumes rose 10.8% year on year, in line with the same quarter last year
- Market Capitalization: $49.64 billion
Company Overview
Founded in 1967, Fastenal (NASDAQ: FAST) provides industrial and construction supplies, including fasteners, tools, safety products, and many other product categories to businesses globally.
Revenue Growth
A company’s long-term sales performance is one signal of its overall quality. Any business can experience short-term success, but top-performing ones enjoy sustained growth for years. Regrettably, Fastenal’s sales grew at a mediocre 7% compounded annual growth rate over the last five years. This fell short of our benchmark for the industrials sector and is a poor baseline for our analysis.
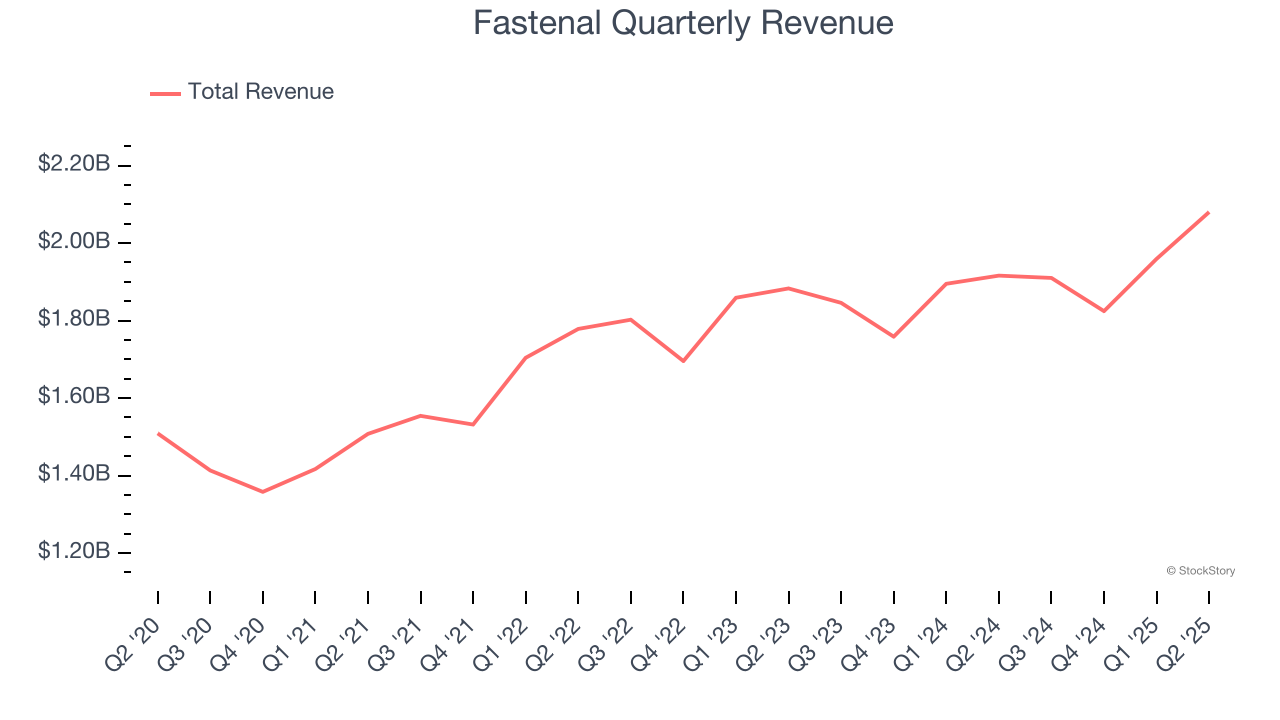
Long-term growth is the most important, but within industrials, a half-decade historical view may miss new industry trends or demand cycles. Fastenal’s recent performance shows its demand has slowed as its annualized revenue growth of 3.6% over the last two years was below its five-year trend. 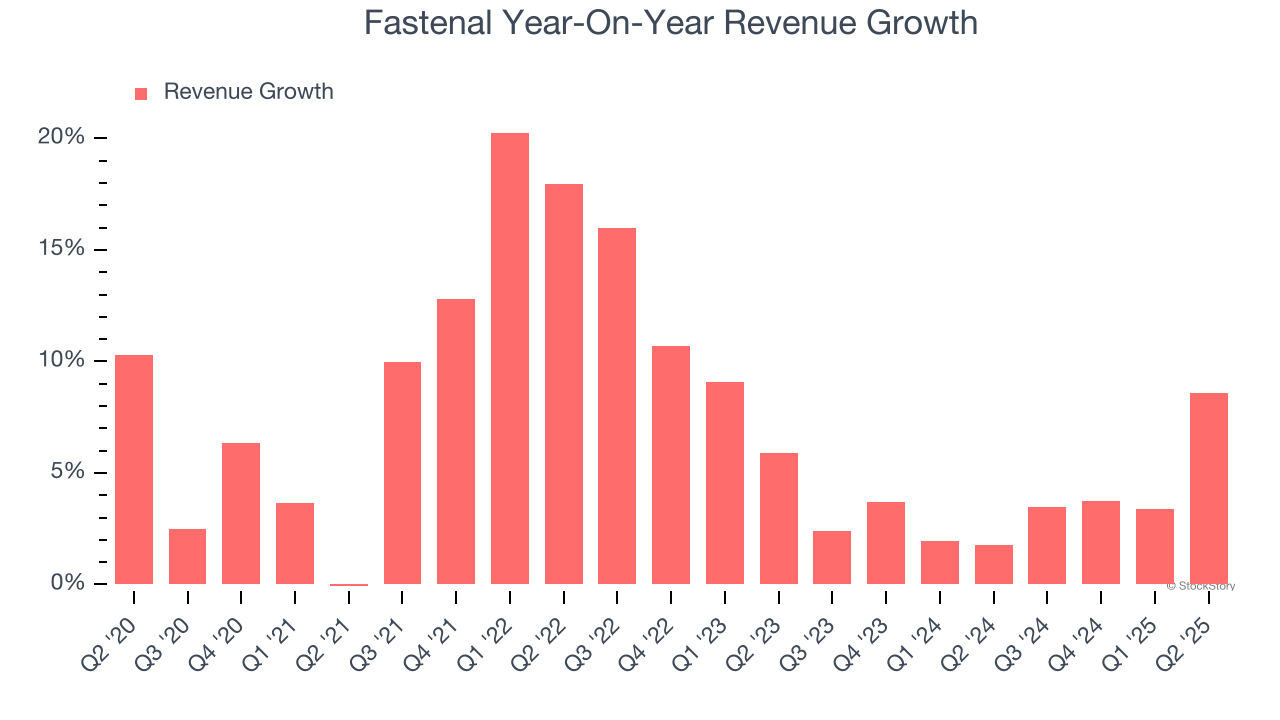
Fastenal also reports its number of units sold, which reached 132,174 in the latest quarter. Over the last two years, Fastenal’s units sold averaged 11.3% year-on-year growth. Because this number is better than its revenue growth, we can see the company’s average selling price decreased. 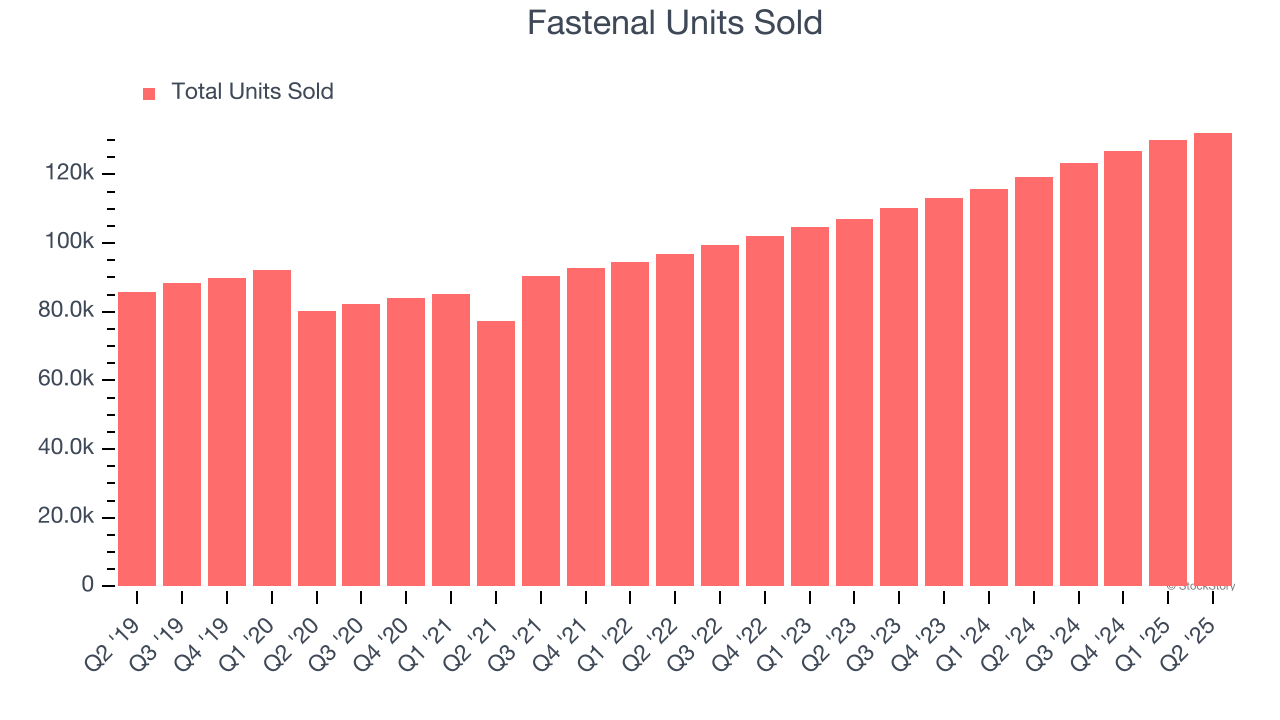
This quarter, Fastenal reported year-on-year revenue growth of 8.6%, and its $2.08 billion of revenue exceeded Wall Street’s estimates by 0.5%.
Looking ahead, sell-side analysts expect revenue to grow 8.8% over the next 12 months, an improvement versus the last two years. This projection is above the sector average and implies its newer products and services will spur better top-line performance.
Today’s young investors won’t have read the timeless lessons in Gorilla Game: Picking Winners In High Technology because it was written more than 20 years ago when Microsoft and Apple were first establishing their supremacy. But if we apply the same principles, then enterprise software stocks leveraging their own generative AI capabilities may well be the Gorillas of the future. So, in that spirit, we are excited to present our Special Free Report on a profitable, fast-growing enterprise software stock that is already riding the automation wave and looking to catch the generative AI next.
Operating Margin
Operating margin is an important measure of profitability as it shows the portion of revenue left after accounting for all core expenses – everything from the cost of goods sold to advertising and wages. It’s also useful for comparing profitability across companies with different levels of debt and tax rates because it excludes interest and taxes.
Fastenal’s operating margin might fluctuated slightly over the last 12 months but has generally stayed the same, averaging 20.4% over the last five years. This profitability was elite for an industrials business thanks to its efficient cost structure and economies of scale. This result isn’t surprising as its high gross margin gives it a favorable starting point.
Looking at the trend in its profitability, Fastenal’s operating margin might fluctuated slightly but has generally stayed the same over the last five years. This raises questions about the company’s expense base because its revenue growth should have given it leverage on its fixed costs, resulting in better economies of scale and profitability.
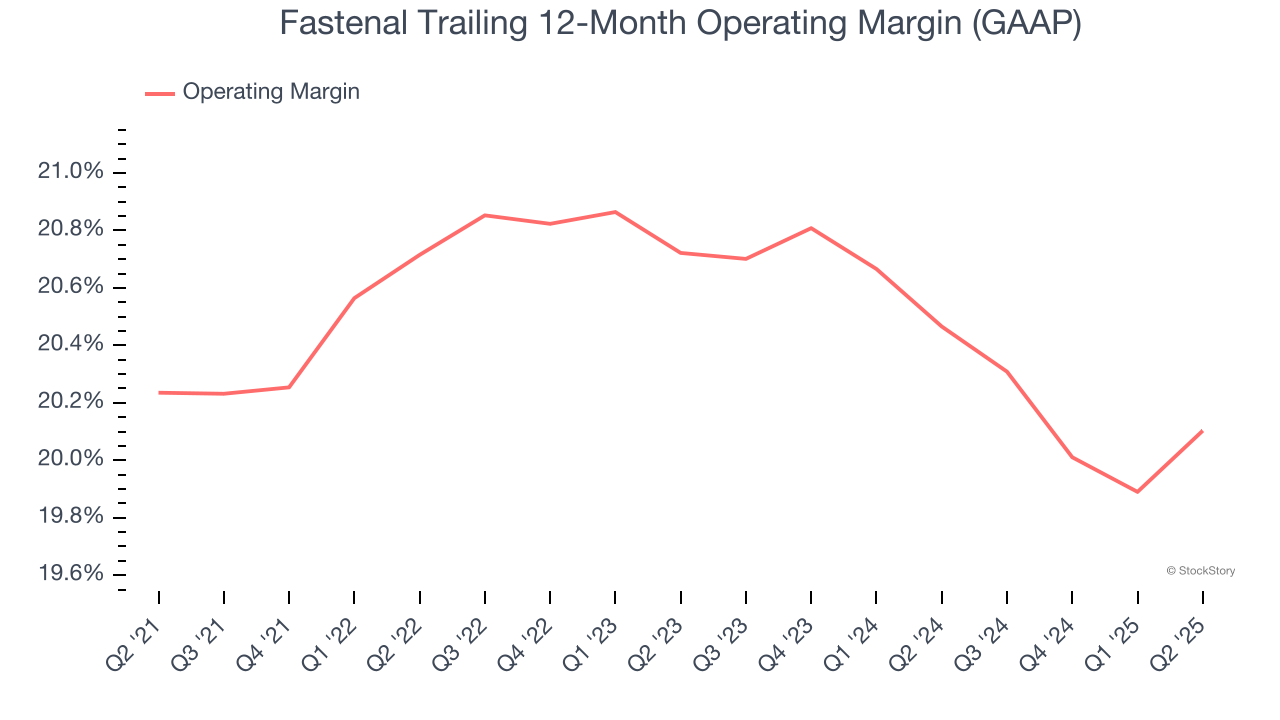
In Q2, Fastenal generated an operating margin profit margin of 21%, in line with the same quarter last year. This indicates the company’s cost structure has recently been stable.
Earnings Per Share
We track the long-term change in earnings per share (EPS) for the same reason as long-term revenue growth. Compared to revenue, however, EPS highlights whether a company’s growth is profitable.
Fastenal’s unimpressive 7.4% annual EPS growth over the last five years aligns with its revenue performance. This tells us it maintained its per-share profitability as it expanded.
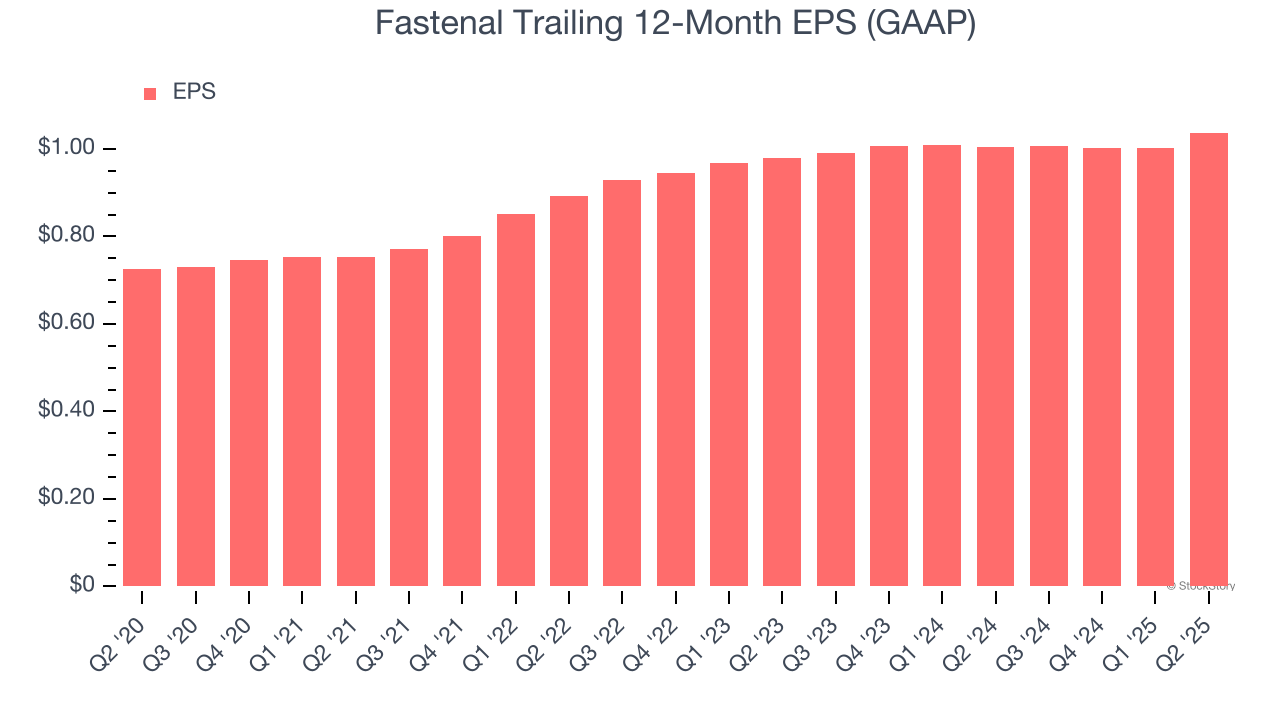
Like with revenue, we analyze EPS over a shorter period to see if we are missing a change in the business.
For Fastenal, its two-year annual EPS growth of 2.9% was lower than its five-year trend. We hope its growth can accelerate in the future.
In Q2, Fastenal reported EPS at $0.29, up from $0.25 in the same quarter last year. This print beat analysts’ estimates by 3.7%. Over the next 12 months, Wall Street expects Fastenal’s full-year EPS of $1.04 to grow 9.9%.
Key Takeaways from Fastenal’s Q2 Results
We were impressed by how significantly Fastenal blew past analysts’ sales volume expectations this quarter. We were also happy its EBITDA narrowly outperformed Wall Street’s estimates. Overall, we think this was a decent quarter with some key metrics above expectations. The stock traded up 3% to $44.61 immediately following the results.
Fastenal may have had a good quarter, but does that mean you should invest right now? We think that the latest quarter is only one piece of the longer-term business quality puzzle. Quality, when combined with valuation, can help determine if the stock is a buy. We cover that in our actionable full research report which you can read here, it’s free.


