The TJX Companies, Inc. (TJX), based in Framingham, Massachusetts, is a top off-price retailer offering apparel and home goods globally. It operates popular brands such as T.J. Maxx, Marshalls, and HomeGoods, with over 5,000 stores across nine countries. TJX specializes in providing brand-name merchandise at prices 20% to 60% below those of traditional retailers through a flexible, opportunistic buying approach.
The company also operates multiple e-commerce platforms, serving diverse value-focused customers worldwide. It has a market capitalization of $170.42 billion, indicating it is a “large-cap” stock.
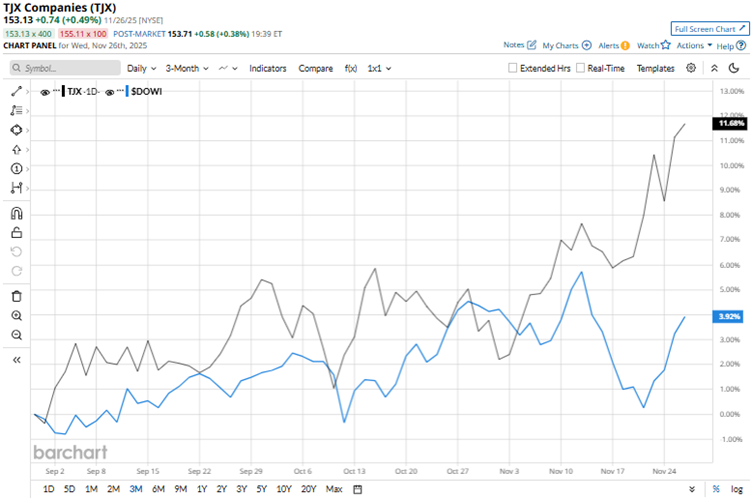
TJX’s stock reached a 52-week high of $154.66 on Nov. 26, and is only down marginally from that level. Solid financials and a raised outlook have led the stock to surge 12% over the past three months. On the other hand, the broader Dow Jones Industrial Average ($DOWI) is up 4.4% over the same period. Therefore, TJX’s stock has outperformed the wider index over this period.
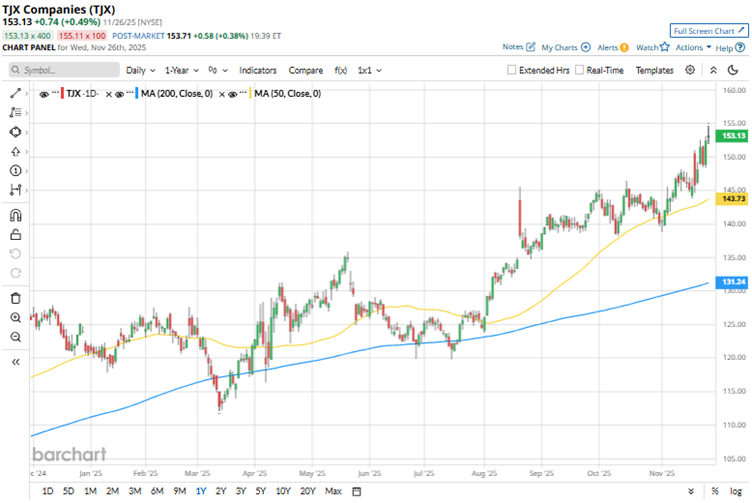
Over the longer term, this outperformance persists. Over the past 52 weeks, TJX’s shares have gained 21.3%, while they have been up 21.8% over the past six months. In contrast, the Dow Jones Industrial Average is up 5.7% and 14% over the same period, respectively. The stock has been trading above its 200-day moving average since late July and above the 50-day moving average since early November.
On Nov. 19, TJX reported its third-quarter results for fiscal 2026 (the quarter ended Nov. 1). In that, the company recorded a 7.5% year-over-year (YOY) increase in net sales to $15.12 billion, surpassing the $14.88 billion expected by Wall Street analysts. This was led by a 7.1% YOY growth in the Marmaxx U.S. segment sales to $9.04 billion.
TJX also reported a 5% growth in its comparable sales, which was higher than the 3% recorded in the prior year’s period. This was, once again, led by Marmaxx’s comparable sales growth, jumping from 2% to 6%, while TJX Canada’s comparable sales growth rose from 2% to 8%.
TJX’s EPS grew by 12.3% YOY to $1.28, exceeding the $1.22 expected by analysts. The company also raised its fiscal 2026 pretax profit margin to 11.6%, while EPS is expected to be in the range of $4.63 to $4.66.
We compare TJX’s performance with that of another apparel retailer, Ross Stores, Inc. (ROST), which has climbed 15.1% over the past 52 weeks and gained 29.5% over the past six months. Therefore, TJX has outperformed Ross Stores over the past year.
Wall Street analysts are strongly bullish on TJX’s stock. The stock has a consensus rating of “Strong Buy” from the 20 analysts covering it. The mean price target of $163.36 indicates a 6.7% upside compared to current levels. Moreover, the Street-high price target of $181 indicates an 18.2% upside.
On the date of publication, Anushka Mukherjee did not have (either directly or indirectly) positions in any of the securities mentioned in this article. All information and data in this article is solely for informational purposes. For more information please view the Barchart Disclosure Policy here.
More news from Barchart


