Secure identity platform provider Clear Secure, Inc. (YOU) demonstrated its commitment to shareholder returns through its capital allocation strategy. Last month, the company declared a $100 million increase to its existing Class A common stock share repurchase program.
Clear Secure also declared a quarterly dividend of $0.09 per share, compared to $0.07 last quarter, and a special cash dividend of $0.55 per share. The dividends were payable to shareholders on November 22, 2023.
Furthermore, the company reported strong results in its last reported quarter. For the third quarter, YOU’s revenue increased 38.4% year-over-year to $160.39 million, while its adjusted net income and adjusted net income per share came in at $31.47 million and $0.21, up significantly from the prior-year period, respectively.
Given such strong recent fundamentals, let’s look at the trends of YOU’s key financial metrics to understand why the stock could be a solid buy now.
Analyzing Fluctuating Financial Trends and Recovery Signs of Clear Secure (2020-2023)
YOU's trailing-12-month revenue has seen a positive trend and even noticeable fluctuations over the past few years.
- Beginning with a reported revenue of $230.80 million on December 31, 2020,
- there was an increase to $253.95 million by the end of 2021.
- Interestingly, the first quarter of 2022 saw another growth as revenue rose to $293.93 million.
- This upward trajectory continued throughout 2022, with reported values of $341.48 million and $389.84 million in June and September, respectively,
- and a year-end figure of $437.43 million on December 31, 2022.
- In the first quarter of 2023, YOU reported a further increase in revenue to $479.25 million.
- followed by $526.40 million and $570.87 million in June and September of the same year.
The sustained growth through each consecutive quarter is noteworthy, particularly stronger in the more recent data. The difference in revenue between the first recorded value in December 2020 ($230.80 million) and the last recorded value in September 2023 ($570.87 million) shows a significant increase. This results in a growth rate of approximately 147.3% over almost three years.

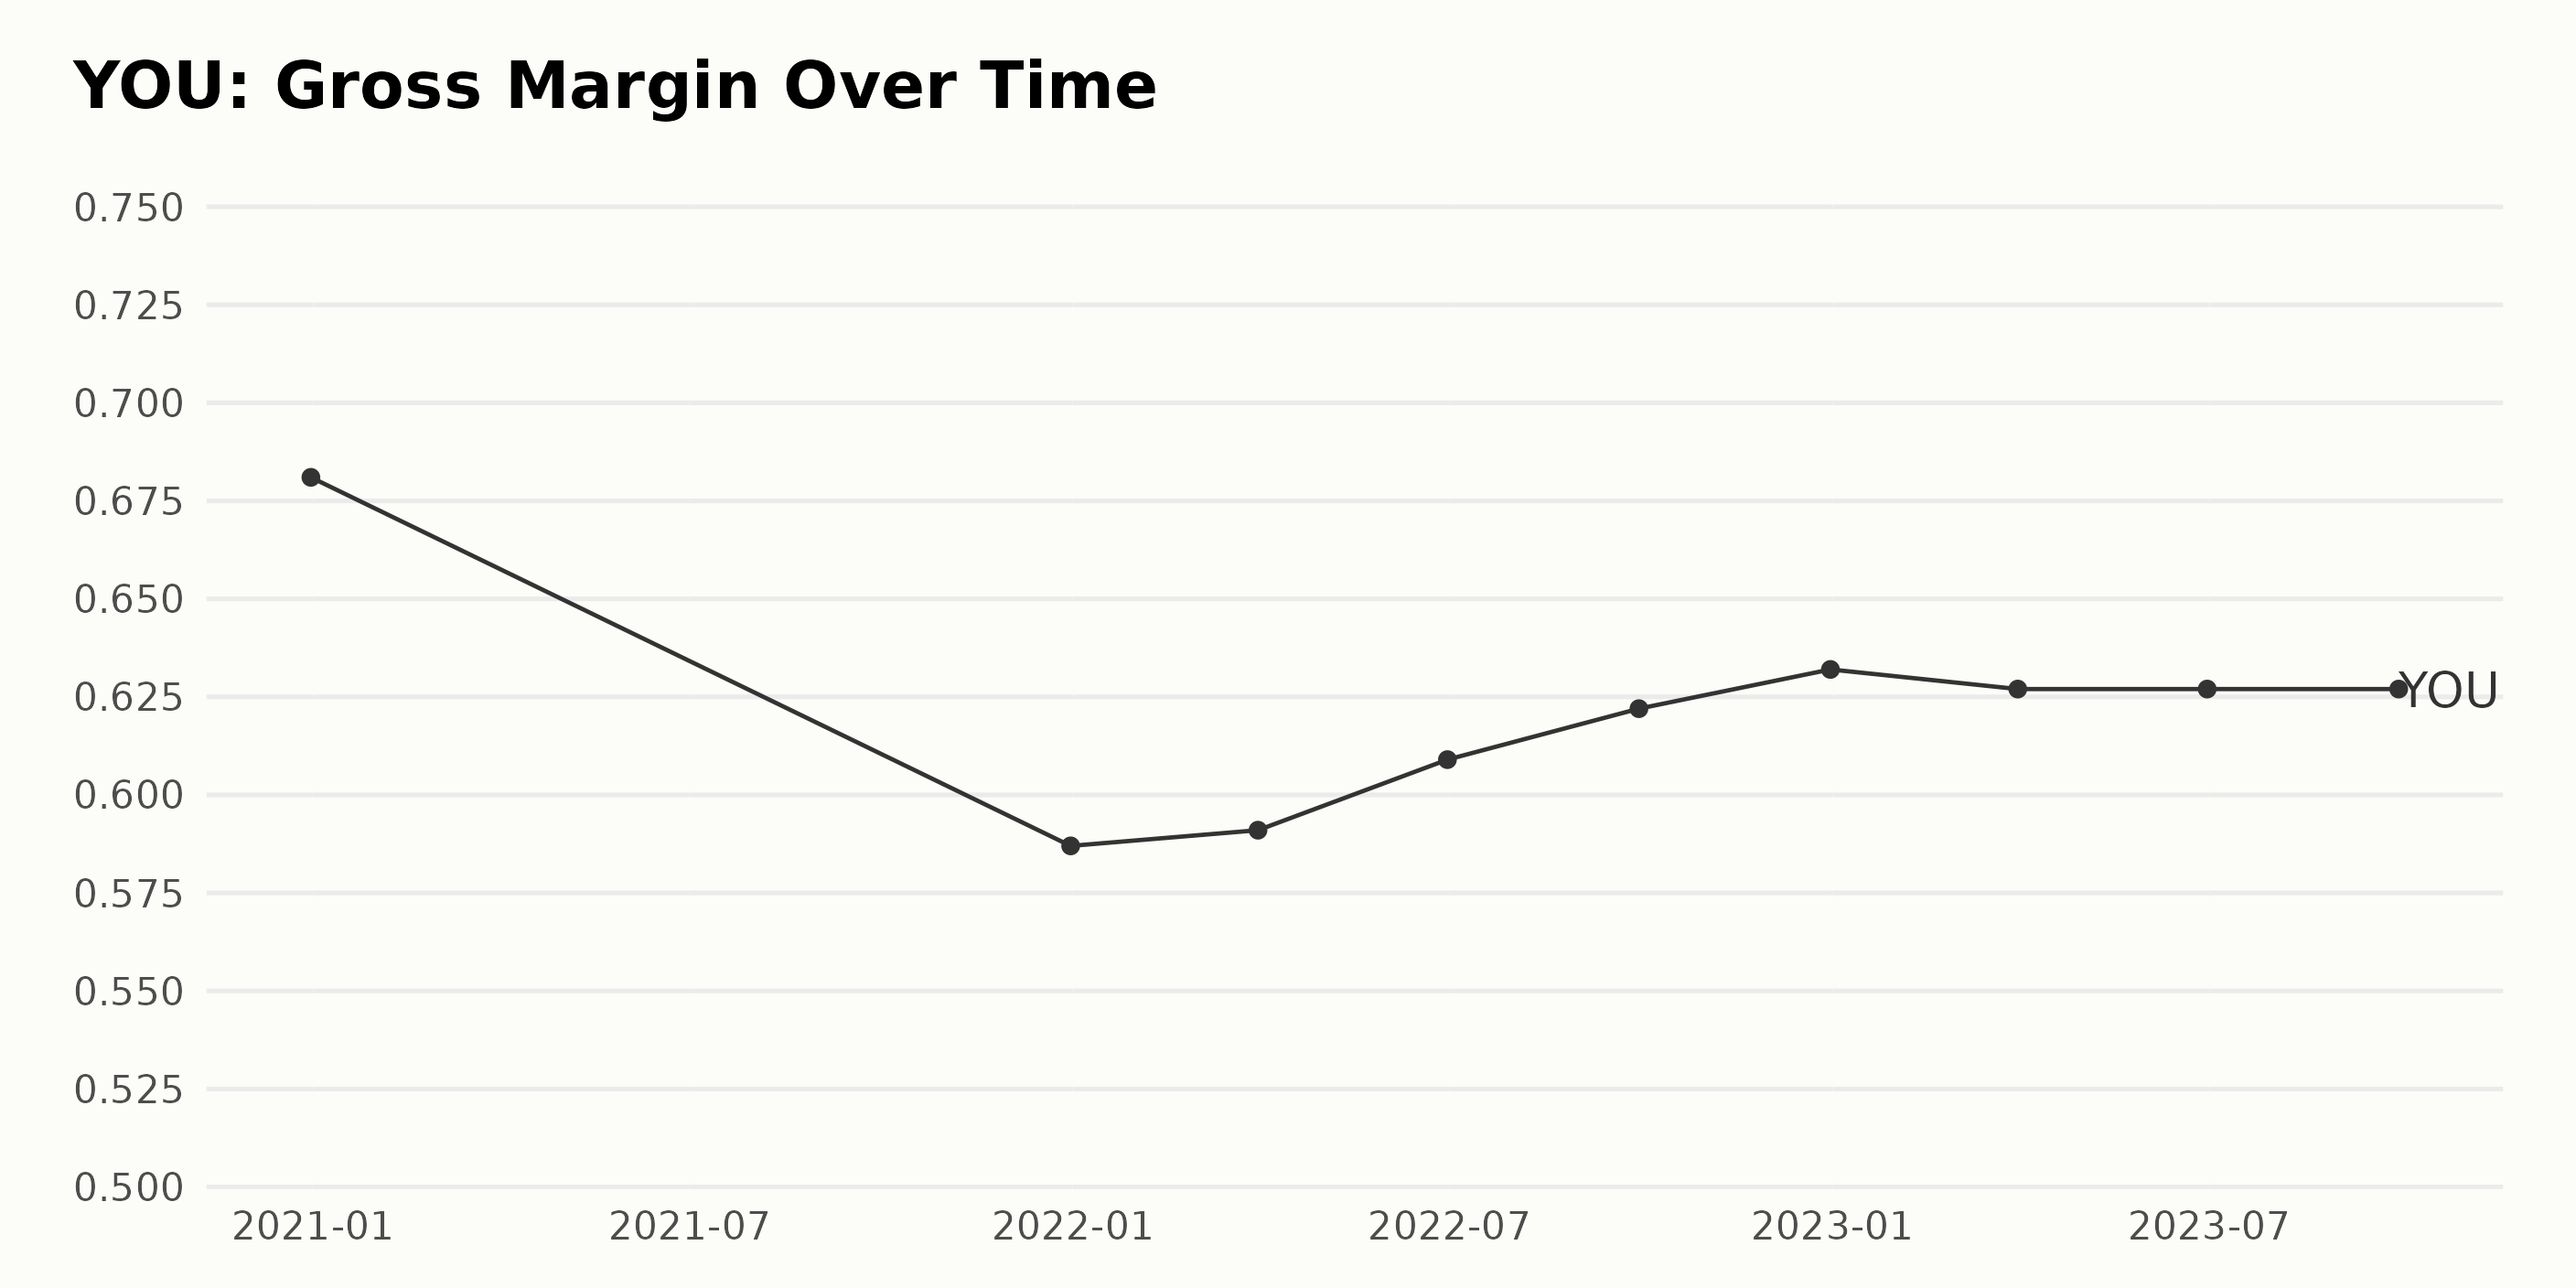
YOU's gross margin has experienced a general but not consistent increasing trend over the recorded period, with certain instances of fluctuations. Presented below is the summarized trend and fluctuation per quarter, along with the gross margin percentages:
- December 2020 registered a gross margin of 68.10%.
- The margin dipped notably to 58.70% by December 2021.
- A slight uptick was seen in March 2022 at 59.10%.
- Steady improvement was recorded in the first half of 2022, with June listing a gross margin of 60.90%.
- The uptrend continued until the last quarter of 2022, reaching a peak of 63.20% in December.
- However, from March to September 2023, the gross margin stayed at 62.70% despite the previous continuous improvement.
Analyzing the growth rate from the first value (December 2020: 68.10%) to the last (September 2023: 62.70%), it's apparent that YOU's gross margin has decreased by approximately 5.40% over this period.
Despite these fluctuating figures, the latter part of the presented data suggests more stability in the gross margin rate. Refreshed and comprehensive data, especially from the remaining quarter of 2023, will be crucial in indicating any resurgence or further decline.
The given data encapsulates the reported Return On Assets (ROA) for the company from December 31, 2021, to September 30, 2023. The data indicates a fluctuating trend with an overall tendency toward improvement. Key Summary:
- YOU's ROA on December 31, 2021, was -0.066.
- The first quarter of 2022 saw a slight increase in negative value to -0.068.
- The circumstances improved by the end of the second quarter of 2022, where the ROA was stated as -0.062.
- However, in the third quarter of 2022, there was a decline, with the ROA dropping to its lowest at -0.083.
- By the close of 2022, ROA recovered slightly to -0.071.
- In the first half of 2023, the negative ROA continued to improve, recording -0.062 and -0.048 by the end of the first and second quarters, respectively.
- The major turnaround occurred in the third quarter of 2023 when the ROA became positive for the first time during this period, recording 0.003.
Between the initial data point (December 31, 2021) and the final one (September 30, 2023), ROA reflects a growth rate of approximately 106.06%. In synthesis, the company experienced notable fluctuations in its ROA over the reported period. Yet, a discernible trend of recovery and improvement is observed, especially eminent with the shift to positive ROA by the end of the third quarter of 2023.

Analyzing the asset turnover of YOU, we notice the following trends and fluctuations:
- At the start of this data series on December 31, 2021, the asset turnover stood at 0.464.
- There was a slight decrease in the following quarter to 0.429 as of March 31, 2022.
- The asset turnover further declined to reach 0.410 by June 30, 2022.
- This downward trend reversed, with the value rising to 0.451 on September 30, 2022.
- By the end of 2022 (December 31), the asset turnover had marginally increased to 0.475.
- In the first quarter of 2023 (March 31), the value further rose to 0.489.
- This upward trend persisted through June 30, 2023, with the asset turnover increasing to 0.512.
- The last available data point is for September 30, 2023, where the asset turnover reached its peak at 0.534 in the analyzed period.
From December 31, 2021, to September 30, 2023, the asset turnover shows a growth rate of about 15.09% despite experiencing some fluctuations in the initial quarters of 2022. More recent data, particularly from late 2022 and throughout 2023, indicates a consistent upward trend in the Asset Turnover of YOU.

Tracking the Fluctuating Share Price of Clear Secure from June to November 2023
YOU's share price shows a clear declining trend from June 2023 to November 2023.
- In June 2023, the share price started at $24.18 and reached $23.11 by the end of the month, marking a decrease of approximately 4.42%
- In July 2023, the share price saw fluctuations, starting the month at $22.68 and increasing to $24.72 in the middle of the month. However, by the end, it had again decreased to $23.13, indicating an overall decline compared to the beginning of the month.
- August 2023 saw a slight increase in price initially to $24.04 but closed the month at $21.95, representing an overall decrease of roughly 10.4% for the month.
- During September 2023, the price continued to fall from $21.87 to $18.56, marking a notable 15.12% decrease.
- In October 2023, the downward trend in price increased its pace as it slipped from $17.32 to $16.94 by the end of the month, further diving down to a 2.19% depreciation.
- In November 2023, a reversal is noticeable when the price begins to ascend from $17.14 to close the month at $19.50.
From this data, we can observe that the share price has had a clear decelerating trend from June to October 2023, with the rate of decline fluctuating between months. However, in November, there appears to be a reversing trend with an accelerating rate of increase. Here is a chart of YOU's price over the past 180 days.

Evaluating Clear Secure's POWR Ratings: Growth, Value, and Quality Perspectives
The POWR Ratings grade of the stock known as YOU, within the Software - Security category, has seen some fluctuation over time. It appears to have improved its ranking within the category, indicating a superior position. The latest data available showcases this progression:
- As of June 10, 2023, its POWR grade was C (Neutral), with a ranking of #14 of 22 stocks in its category.
- The rank steadily fluctuated, with some improvement seen by July 22, 2023, when it ranked #11.
- There was a significant improvement in August 2023, with the rank improving to #7 by August 9, 2023.
- There were minor fluctuations in September and October 2023, but the rank remained largely consistent at around #8.
- By November 18, 2023, there was a marked improvement in both the POWR grade and category rank. The grade was upgraded to B (Buy), and the rank improved to #7.
- The latest available data indicates that YOU carries a POWR grade of B (Buy) and has improved its rank in the Software - Security category to #6.
These data points suggest a general improvement in the stock’s position within the category over time.
Analyzing the POWR Ratings for YOU, the three most significant dimensions are Growth, Value, and Quality.
Growth: The highest rating is given to this dimension. Initially, in June 2023, it had a score of 85, which indicates strong growth prospects. There was a small increase to 89 in August 2023, but subsequently, it slightly dropped back down to 86 by November 2023. While there's trivial fluctuation, the Growth dimension consistently receives high ratings.
Value: This dimension also represented strong performance. Value initially stood at 75 in June 2023. It showed a promising upward trend as the value reached its peak at 89 by the end of November 2023. This continuous positive trend indicates solid value prospects for YOU.
Quality: This dimension had the lowest starting value of 52 in June 2023 among the three. However, it experienced a consistent upward trajectory, eventually scoring 65 by November 2023. This stable and sustained improvement reflects positively on the Quality aspect of YOU.
Overall, all three dimensions demonstrated a positive trend. Growth and Value maintained impressive scores throughout the period, while Quality showed consistent improvement over time.

How does Clear Secure, Inc. (YOU) Stack Up Against its Peers?
Other stocks in the Software - Security sector that may be worth considering are Darktrace plc (DRKTY), Trend Micro Incorporated (TMICY), and Check Point Software Technologies Ltd. (CHKP) - they have better POWR Ratings. Click here to explore more Software - Security stocks.
What To Do Next?
43 year investment veteran, Steve Reitmeister, has just released his 2024 market outlook along with trading plan and top 11 picks for the year ahead.
YOU shares were trading at $22.04 per share on Friday afternoon, up $0.71 (+3.33%). Year-to-date, YOU has declined -16.77%, versus a 21.39% rise in the benchmark S&P 500 index during the same period.
About the Author: Anushka Dutta

Anushka is an analyst whose interest in understanding the impact of broader economic changes on financial markets motivated her to pursue a career in investment research.
The post Is Clear Secure (YOU) the Right Investment for Secure Returns? appeared first on StockNews.com