Building products manufacturer JELD-WEN (NYSE: JELD) announced better-than-expected revenue in Q2 CY2026, but sales were flat year on year at $817.8 million. The company’s full-year revenue guidance of $3.15 billion at the midpoint came in 1.9% above analysts’ estimates. Its non-GAAP loss of $0.11 per share was 19% above analysts’ consensus estimates.
Is now the time to buy JELD-WEN? Find out by accessing our full research report, it’s free.
JELD-WEN (JELD) Q2 CY2026 Highlights:
- Revenue: $817.8 million vs analyst estimates of $792.6 million (flat year on year, 3.2% beat)
- Adjusted EPS: -$0.11 vs analyst estimates of -$0.14 (19% beat)
- Adjusted EBITDA: $42.3 million vs analyst estimates of $29.4 million (5.2% margin, 43.9% beat)
- The company slightly lifted its revenue guidance for the full year to $3.15 billion at the midpoint from $3.13 billion
- EBITDA guidance for the full year is $135 million at the midpoint, above analyst estimates of $109.4 million
- Operating Margin: -0.6%, up from -1.7% in the same quarter last year
- Free Cash Flow was -$23.8 million, down from $300,000 in the same quarter last year
- Organic Revenue fell 2% year on year
- Market Capitalization: $122.3 million
Company Overview
Founded in the 1960s as a general wood-making company, JELD-WEN (NYSE: JELD) manufactures doors, windows, and other related building products.
Revenue Growth
A company’s long-term sales performance can indicate its overall quality. Any business can put up a good quarter or two, but many enduring ones grow for years. JELD-WEN struggled to consistently generate demand over the last five years as its sales dropped at a 7.3% annual rate. This wasn’t a great result and is a sign of poor business quality.
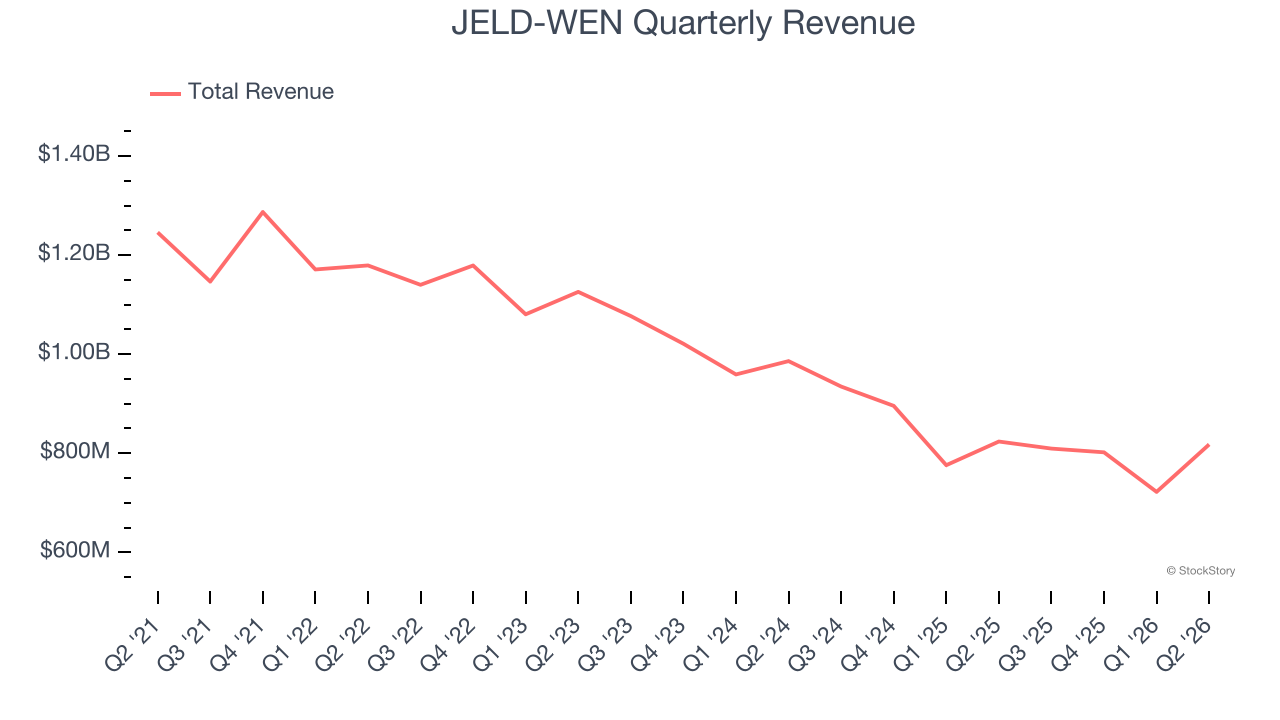
Long-term growth is the most important, but within industrials, a half-decade historical view may miss new industry trends or demand cycles. JELD-WEN’s recent performance shows its demand remained suppressed as its revenue has declined by 11.7% annually over the last two years. 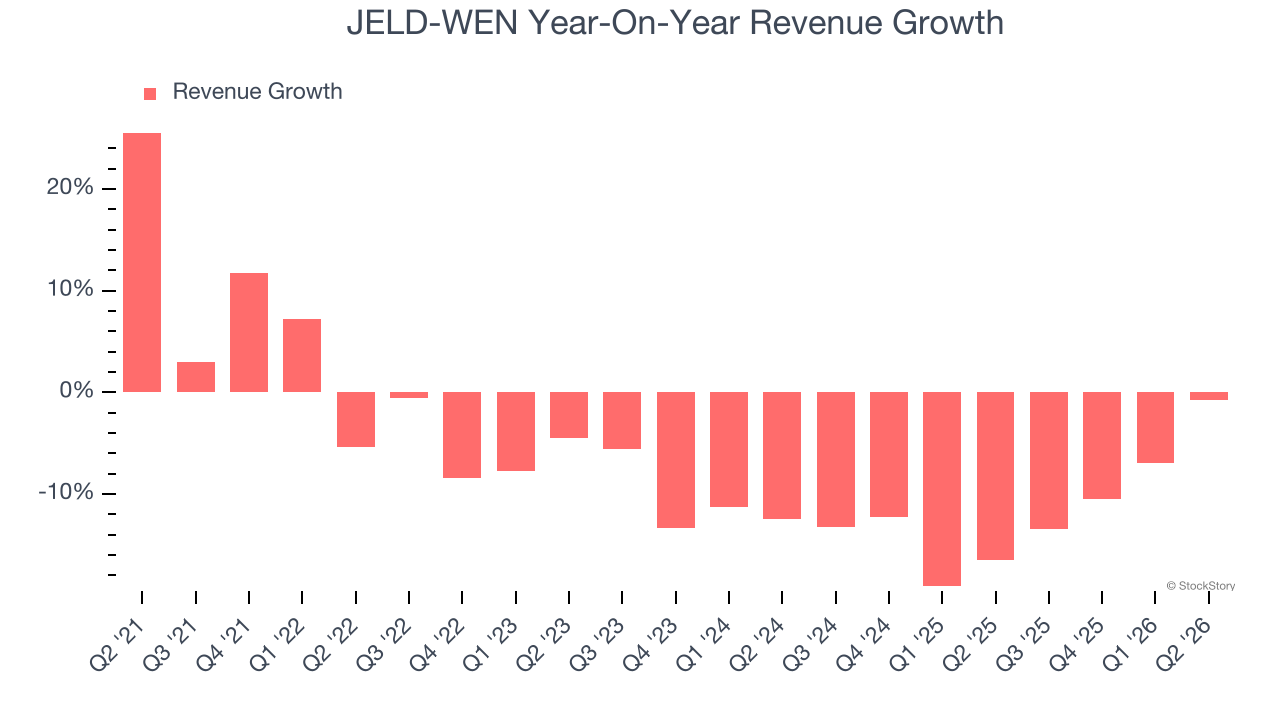
JELD-WEN also reports organic revenue, which strips out one-time events like acquisitions and currency fluctuations that don’t accurately reflect its fundamentals. Over the last two years, JELD-WEN’s organic revenue averaged 10.4% year-on-year declines. Because this number aligns with its two-year revenue growth, we can see the company’s core operations (not acquisitions and divestitures) drove most of its results. 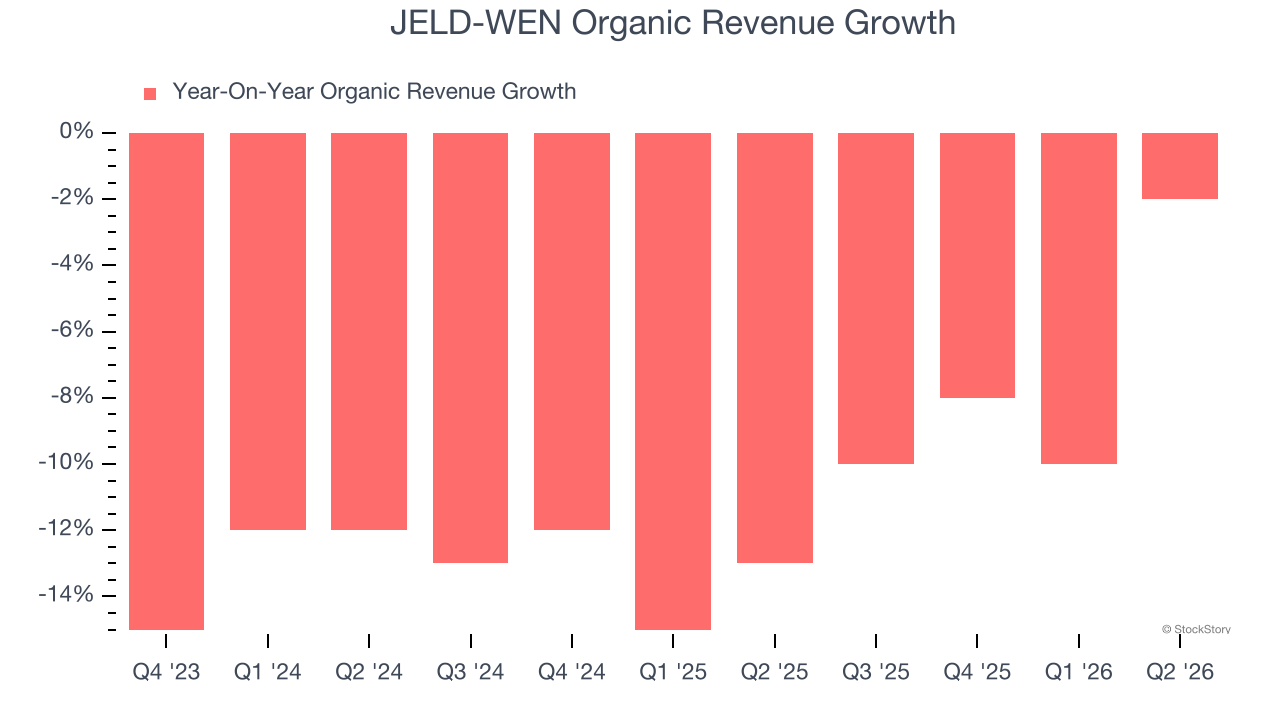
This quarter, JELD-WEN’s $817.8 million of revenue was flat year on year but beat Wall Street’s estimates by 3.2%.
Looking ahead, sell-side analysts expect revenue to decline by 1.5% over the next 12 months. While this projection is better than its two-year trend, it’s hard to get excited about a company that is struggling with demand.
WHILE YOU’RE HERE: The Next Palantir? One satellite company captures images of every point on Earth. Every single day. The Pentagon wants it. Hedge funds are using it to beat earnings. You’ve probably never heard of it.
This is what the early days of Palantir looked like before it became a giant. Same playbook. Different technology. If you missed Palantir, you need to see this. Claim The Stock Ticker for Free HERE.
Operating Margin
Although JELD-WEN broke even this quarter from an operational perspective, it’s generally struggled over a longer time period. Its expensive cost structure has contributed to an average operating margin of negative 1.4% over the last five years. Unprofitable industrials companies require extra attention because they could get caught swimming naked when the tide goes out. It’s hard to trust that the business can endure a full cycle.
Looking at the trend in its profitability, JELD-WEN’s operating margin decreased by 12.6 percentage points over the last five years. JELD-WEN’s performance was poor no matter how you look at it - it shows that costs were rising and it couldn’t pass them onto its customers.
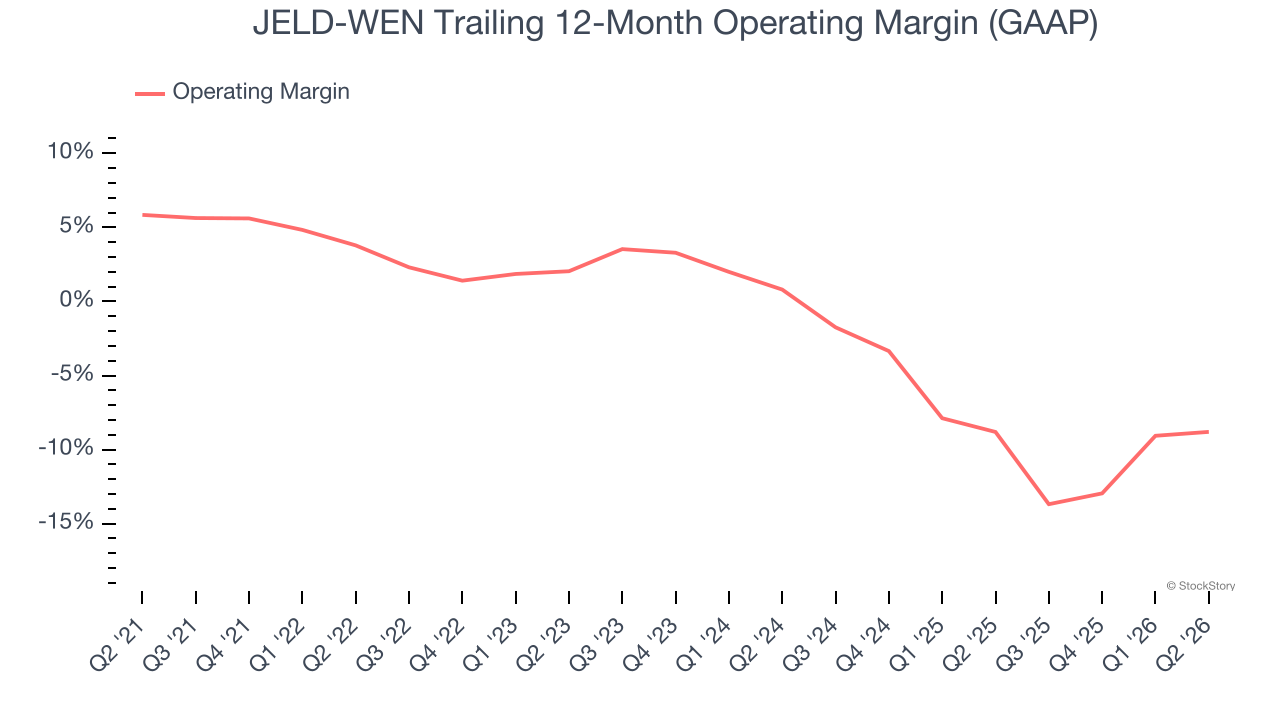
In Q2, JELD-WEN generated a negative 0.6% operating margin. The company’s consistent lack of profits raises a flag.
Earnings Per Share
Revenue trends explain a company’s historical growth, but the long-term change in earnings per share (EPS) points to the profitability of that growth — for example, a company could inflate its sales through excessive spending on advertising and promotions.
Sadly for JELD-WEN, its EPS declined by 21.7% annually over the last five years, more than its revenue. This tells us the company struggled because its fixed cost base made it difficult to adjust to shrinking demand.
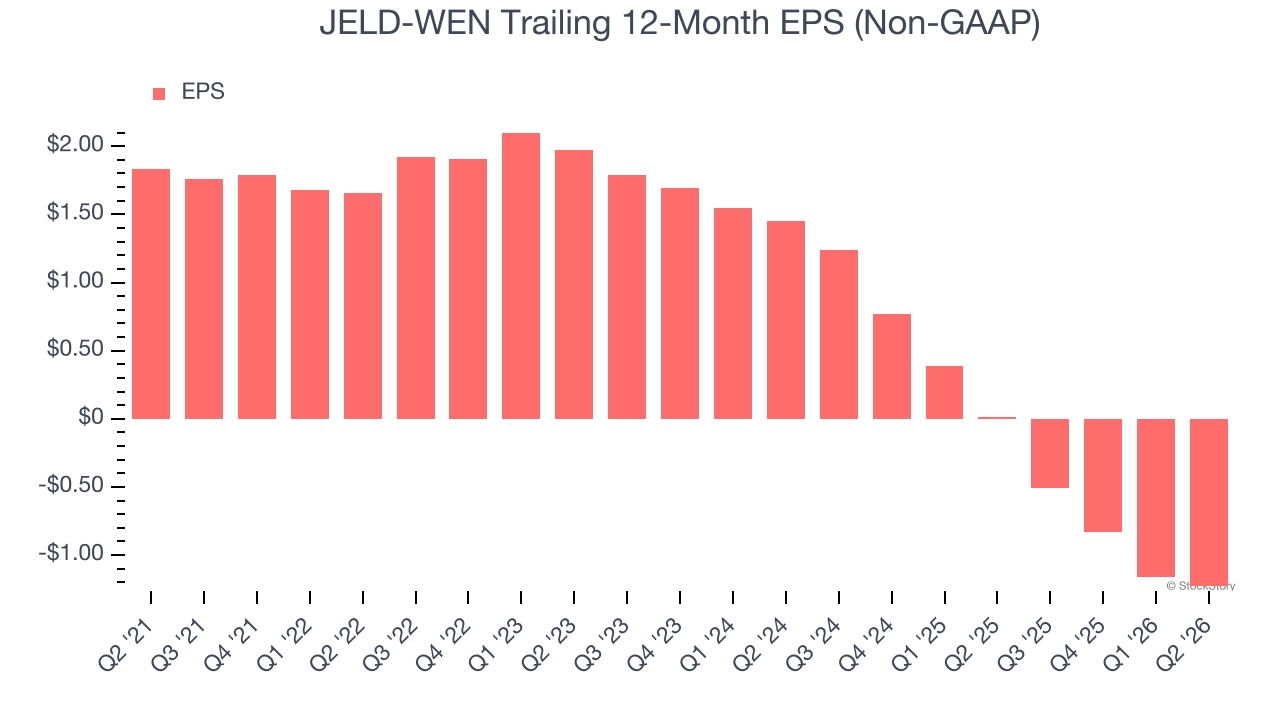
We can take a deeper look into JELD-WEN’s earnings to better understand the drivers of its performance. As we mentioned earlier, JELD-WEN’s operating margin expanded this quarter but declined by 12.6 percentage points over the last five years. This was the most relevant factor (aside from the revenue impact) behind its lower earnings; interest expenses and taxes can also affect EPS but don’t tell us as much about a company’s fundamentals.
Like with revenue, we analyze EPS over a more recent period because it can provide insight into an emerging theme or development for the business.
For JELD-WEN, its two-year annual EPS declines of 68.8% show it’s continued to underperform. These results were bad no matter how you slice the data.
In Q2, JELD-WEN reported adjusted EPS of negative $0.11, down from negative $0.04 in the same quarter last year. Despite falling year on year, this print easily cleared analysts’ estimates. Over the next 12 months, Wall Street expects JELD-WEN to improve its earnings losses. Analysts forecast its full-year EPS will improve from negative $1.23 to negative $0.39.
Key Takeaways from JELD-WEN’s Q2 Results
We were impressed by how significantly JELD-WEN blew past analysts’ EBITDA expectations this quarter. We were also glad its full-year EBITDA guidance trumped Wall Street’s estimates. Zooming out, we think this was a solid print. The stock traded up 19.3% to $1.69 immediately following the results.
JELD-WEN may have had a good quarter, but does that mean you should invest right now? The latest quarter does matter, but not nearly as much as longer-term fundamentals and valuation, when deciding if the stock is a buy. We cover that in our actionable full research report which you can read here (it’s free).