Rail transportation company Greenbrier (NYSE: GBX) fell short of the market’s revenue expectations in Q1 CY2026, with sales falling 22.9% year on year to $587.5 million. The company’s full-year revenue guidance of $2.45 billion at the midpoint came in 15.3% below analysts’ estimates. Its GAAP profit of $0.47 per share was 45.7% below analysts’ consensus estimates.
Is now the time to buy Greenbrier? Find out by accessing our full research report, it’s free.
Greenbrier (GBX) Q1 CY2026 Highlights:
- Revenue: $587.5 million vs analyst estimates of $663.6 million (22.9% year-on-year decline, 11.5% miss)
- EPS (GAAP): $0.47 vs analyst expectations of $0.87 (45.7% miss)
- Adjusted EBITDA: $60.8 million vs analyst estimates of $84.57 million (10.3% margin, 28.1% miss)
- The company dropped its revenue guidance for the full year to $2.45 billion at the midpoint from $2.95 billion, a 16.9% decrease
- EPS (GAAP) guidance for the full year is $3.25 at the midpoint, missing analyst estimates by 21.2%
- Operating Margin: 4.3%, down from 11% in the same quarter last year
- Free Cash Flow Margin: 14.9%, up from 9.4% in the same quarter last year
- Sales Volumes fell 6.5% year on year (-47.5% in the same quarter last year)
- Market Capitalization: $1.49 billion
Company Overview
Having designed the industry’s first double-decker railcar in the 1980s, Greenbrier (NYSE: GBX) supplies the freight rail transportation industry with railcars and related services.
Revenue Growth
A company’s long-term sales performance can indicate its overall quality. Any business can put up a good quarter or two, but many enduring ones grow for years. Over the last five years, Greenbrier grew its sales at a mediocre 6.7% compounded annual growth rate. This was below our standard for the industrials sector and is a tough starting point for our analysis.
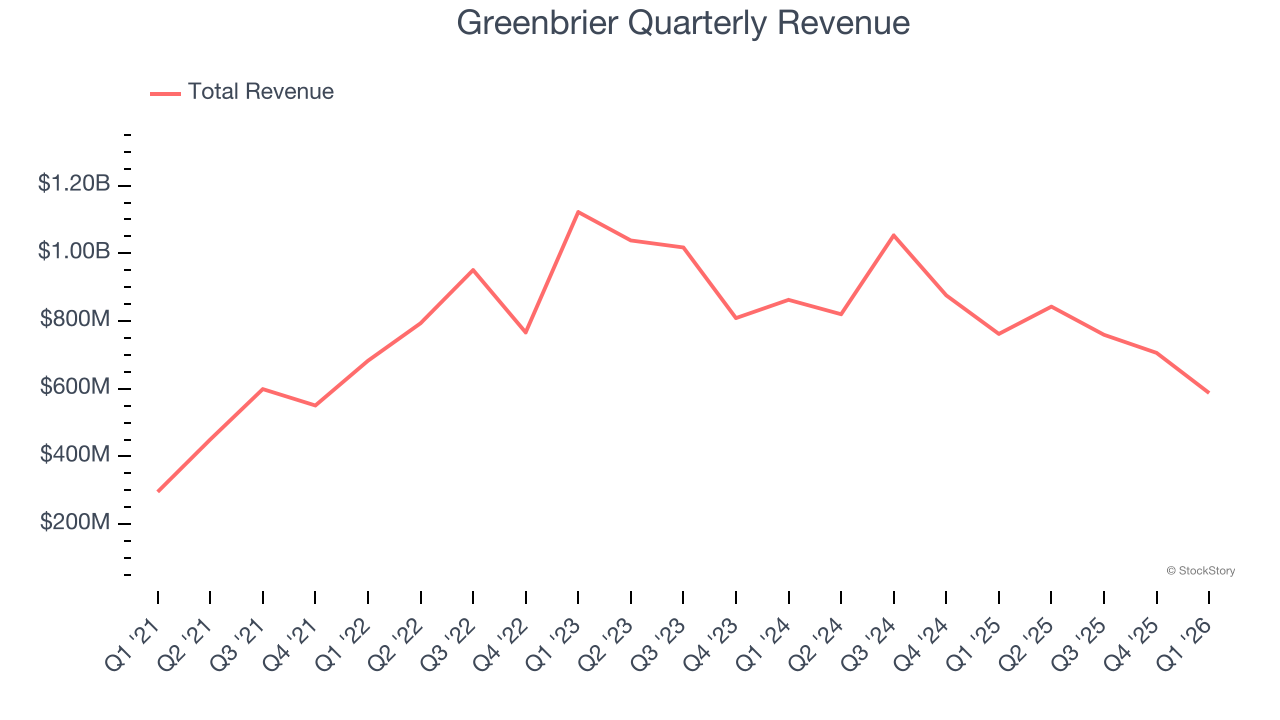
Long-term growth is the most important, but within industrials, a half-decade historical view may miss new industry trends or demand cycles. Greenbrier’s performance shows it grew in the past but relinquished its gains over the last two years, as its revenue fell by 11.9% annually. 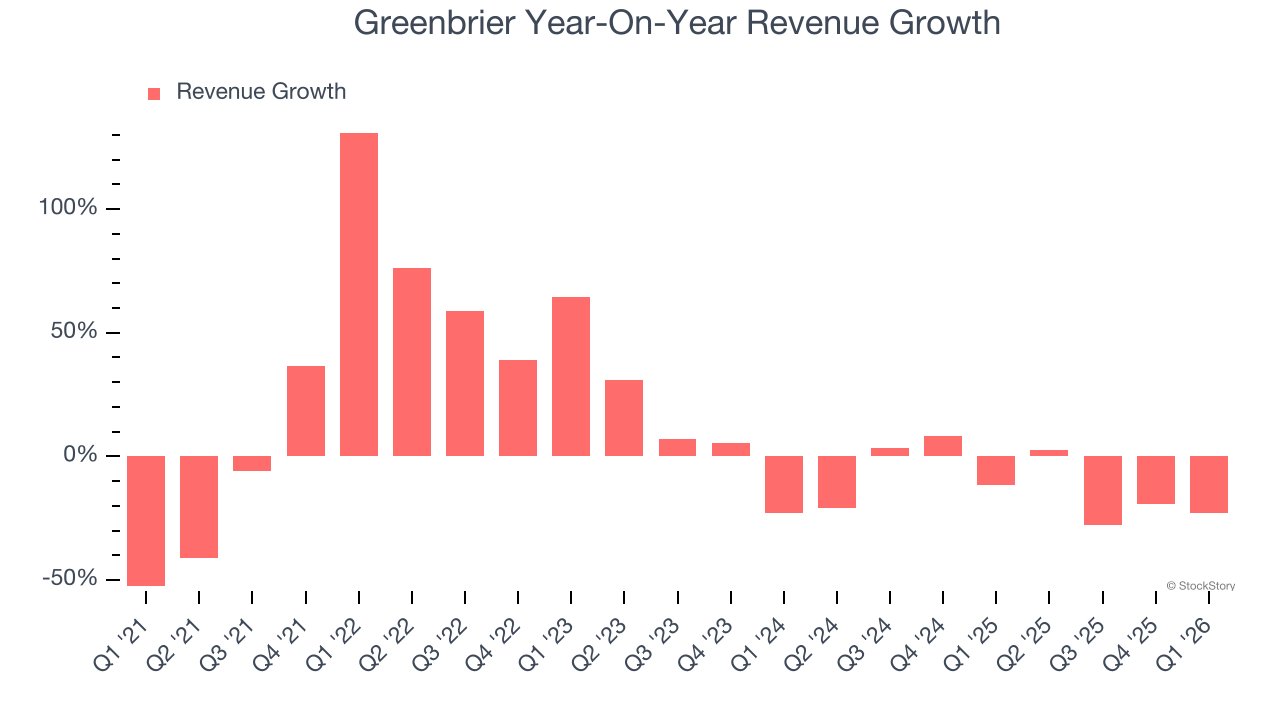
We can better understand the company’s revenue dynamics by analyzing its number of units sold, which reached 2,900 in the latest quarter. Over the last two years, Greenbrier’s units sold averaged 28% year-on-year declines. Because this number is lower than its revenue growth, we can see the company benefited from price increases. 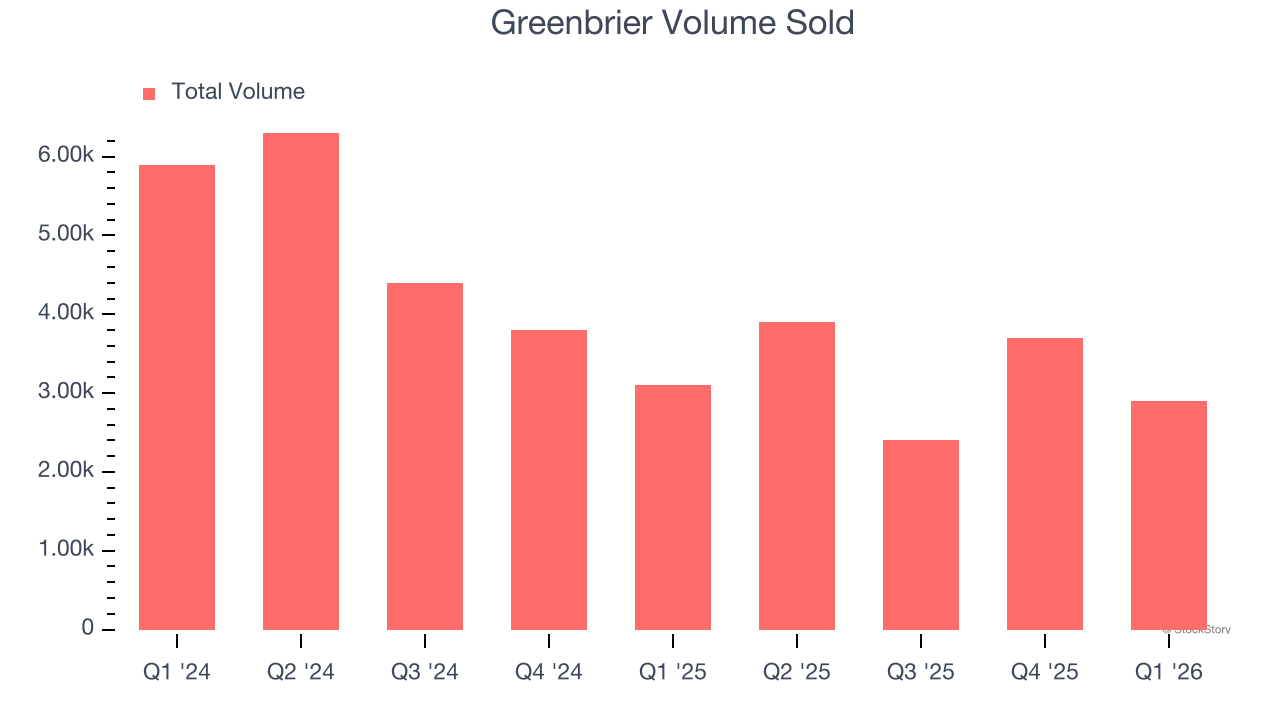
This quarter, Greenbrier missed Wall Street’s estimates and reported a rather uninspiring 22.9% year-on-year revenue decline, generating $587.5 million of revenue.
Looking ahead, sell-side analysts expect revenue to grow 1.2% over the next 12 months. While this projection suggests its newer products and services will catalyze better top-line performance, it is still below average for the sector.
WHILE YOU’RE HERE: The Next Palantir? One satellite company captures images of every point on Earth. Every single day. The Pentagon wants it. Hedge funds are using it to beat earnings. You’ve probably never heard of it.
This is what the early days of Palantir looked like before it became a $437 billion giant. Same playbook. Different technology. If you missed Palantir, you need to see this. Claim The Stock Ticker for Free HERE.
Operating Margin
Operating margin is a key measure of profitability. Think of it as net income - the bottom line - excluding the impact of taxes and interest on debt, which are less connected to business fundamentals.
Greenbrier was profitable over the last five years but held back by its large cost base. Its average operating margin of 7.1% was weak for an industrials business. This result isn’t too surprising given its low gross margin as a starting point.
On the plus side, Greenbrier’s operating margin rose by 4 percentage points over the last five years, as its sales growth gave it operating leverage.
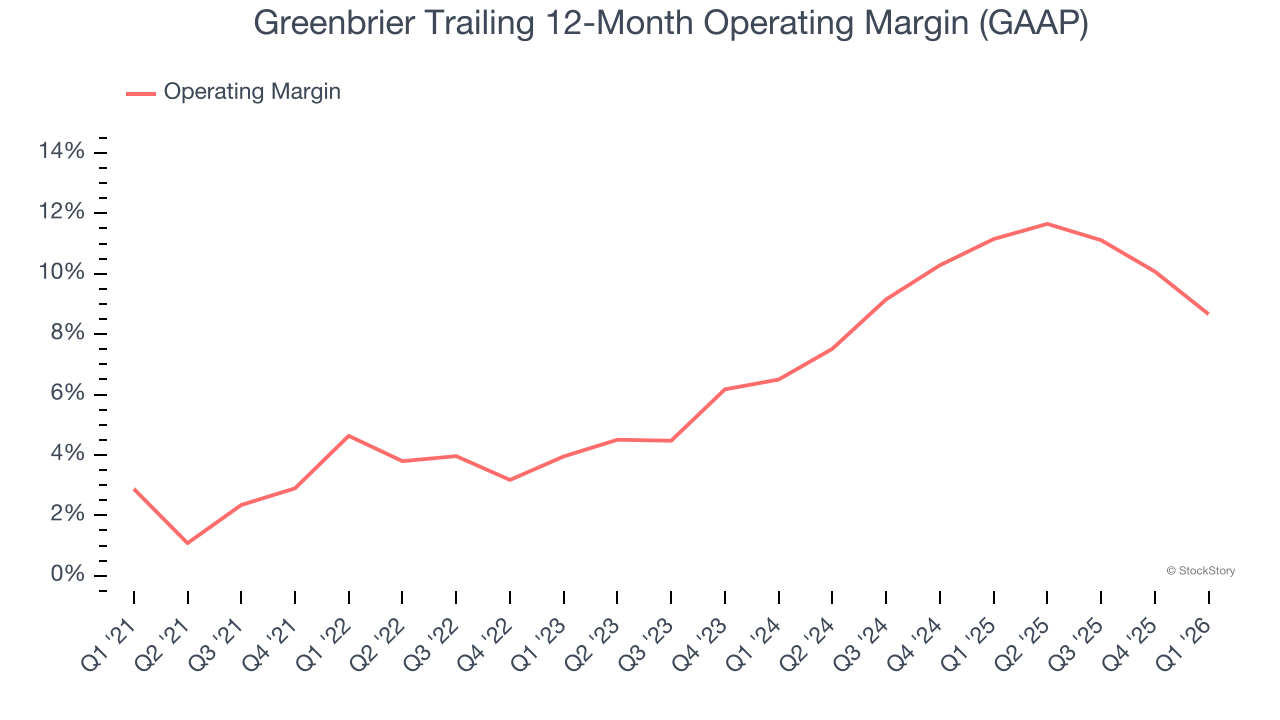
This quarter, Greenbrier generated an operating margin profit margin of 4.3%, down 6.7 percentage points year on year. Since Greenbrier’s operating margin decreased more than its gross margin, we can assume it was less efficient because expenses such as marketing, R&D, and administrative overhead increased.
Earnings Per Share
We track the long-term change in earnings per share (EPS) for the same reason as long-term revenue growth. Compared to revenue, however, EPS highlights whether a company’s growth is profitable.
Greenbrier’s EPS grew at 80.3% compounded annual growth rate over the last five years, higher than its 6.7% annualized revenue growth. This tells us the company became more profitable on a per-share basis as it expanded.
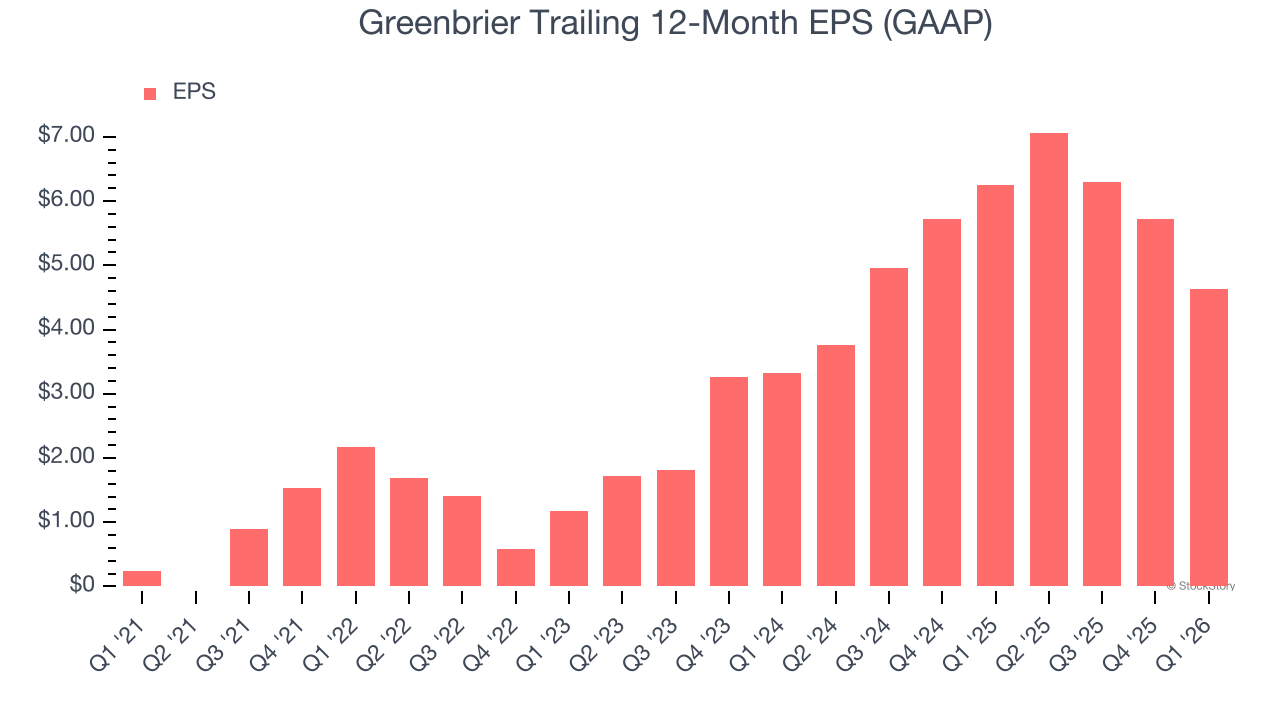
We can take a deeper look into Greenbrier’s earnings to better understand the drivers of its performance. As we mentioned earlier, Greenbrier’s operating margin declined this quarter but expanded by 4 percentage points over the last five years. Its share count also shrank by 3.3%, and these factors together are positive signs for shareholders because improving profitability and share buybacks turbocharge EPS growth relative to revenue growth. 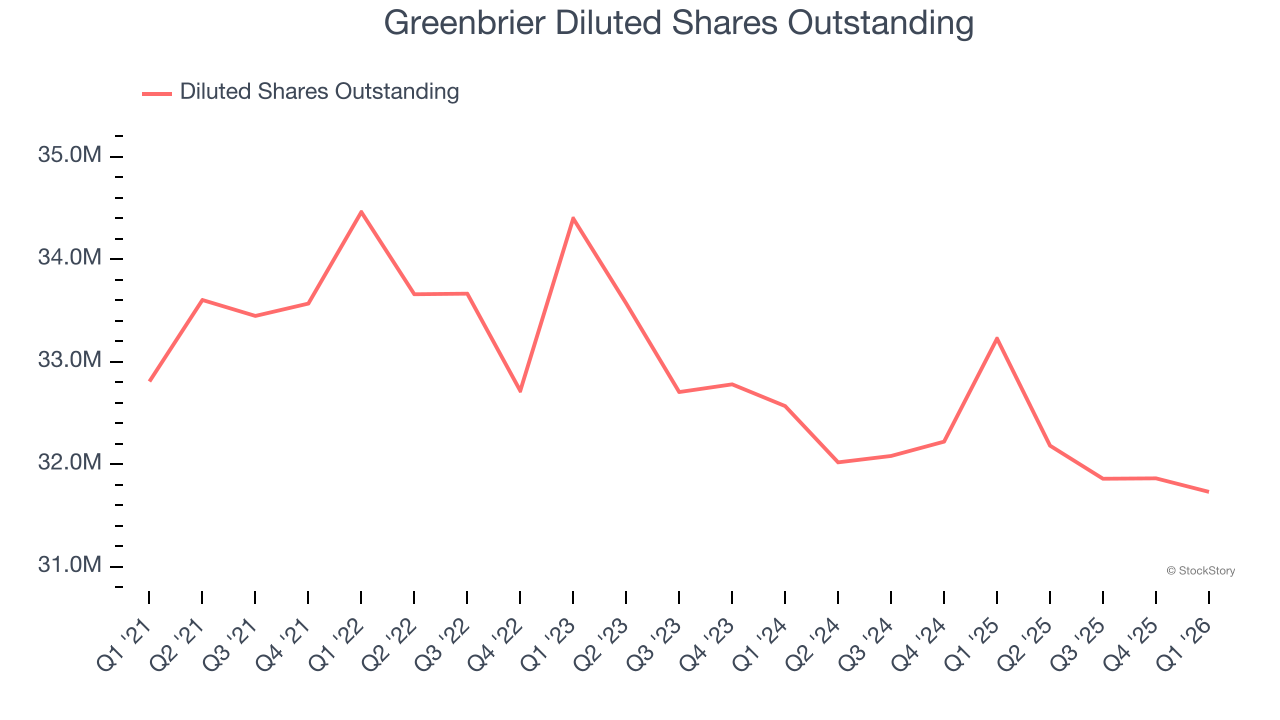
Like with revenue, we analyze EPS over a more recent period because it can provide insight into an emerging theme or development for the business.
For Greenbrier, its two-year annual EPS growth of 17.9% was lower than its five-year trend. We still think its growth was good and hope it can accelerate in the future.
In Q1, Greenbrier reported EPS of $0.47, down from $1.56 in the same quarter last year. This print missed analysts’ estimates, but we care more about long-term EPS growth than short-term movements. We also like to analyze expected EPS growth based on Wall Street analysts’ consensus projections, but there is insufficient data.
Key Takeaways from Greenbrier’s Q1 Results
We struggled to find many positives in these results. Its full-year revenue guidance missed and its full-year EPS guidance fell short of Wall Street’s estimates. Overall, this was a softer quarter. The stock traded down 6.6% to $45 immediately after reporting.
Greenbrier may have had a tough quarter, but does that actually create an opportunity to invest right now? If you’re making that decision, you should consider the bigger picture of valuation, business qualities, as well as the latest earnings. We cover that in our actionable full research report which you can read here (it’s free).