Construction materials company Vulcan Materials (NYSE: VMC) fell short of the market’s revenue expectations in Q3 2026, with revenue falling 4.7% year on year to $2.18 billion. Its non-GAAP profit of $2.83 per share was 0.7% above analysts’ consensus estimates.
For more on Vulcan Materials, read our free full research report.
Vulcan Materials (VMC) Q3 2026 highlights:
- Revenue $2.18 billion vs S&P analysts’ consensus estimates of $2.23 billion (4.7% year-on-year decline, 2.2% miss)
- Adjusted EPS $2.83 vs S&P analysts’ consensus estimates of $2.81 (0.7% beat)
- Adjusted EBITDA $707 million vs analysts’ consensus estimates of $702.2 million (32.4% margin, 0.7% beat)
- EBITDA guidance $2.4 billion at the midpoint for the full year, in line with analysts’ consensus estimates
- Operating margin 24%, in line with the same quarter last year
- Free cash flow margin 9.6%, down from 19.8% in the same quarter last year
- Tons shipped down 41.86 million year on year
- Market capitalization $34.34 billion
Revenue growth
A company’s long-term performance is an indicator of its overall quality. Any business can deliver a good quarter or two, but the best consistently grow over the long haul. Vulcan Materials’s 9.4% annualized revenue growth over the last five years was solid. Its growth beat the average industrials company and shows its offerings resonate with customers.
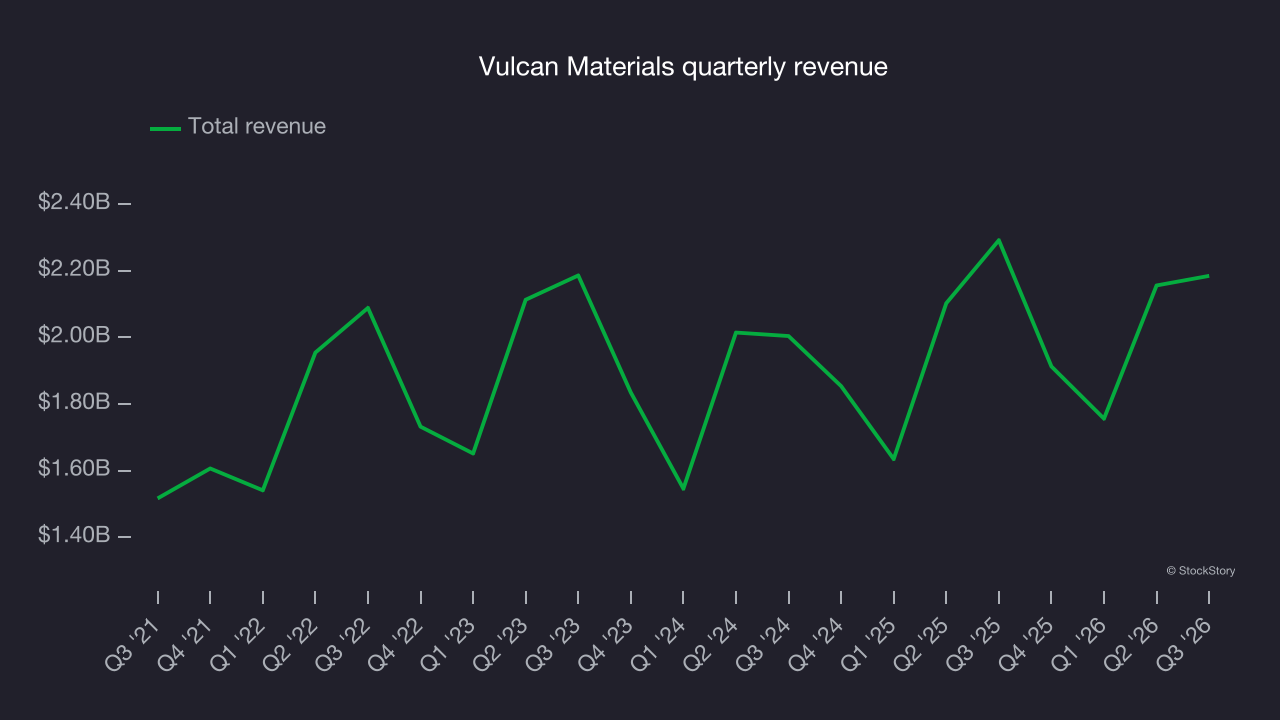
Long-term growth is the most important, but within industrials, a half-decade historical view may miss new industry trends or demand cycles. Vulcan Materials’s recent performance shows its demand has slowed as its annualized revenue growth of 4% over the last two years was below its five-year trend. Decelerating revenue growth in the sector warrants caution, as it could signal changing consumer tastes aided by low switching costs. 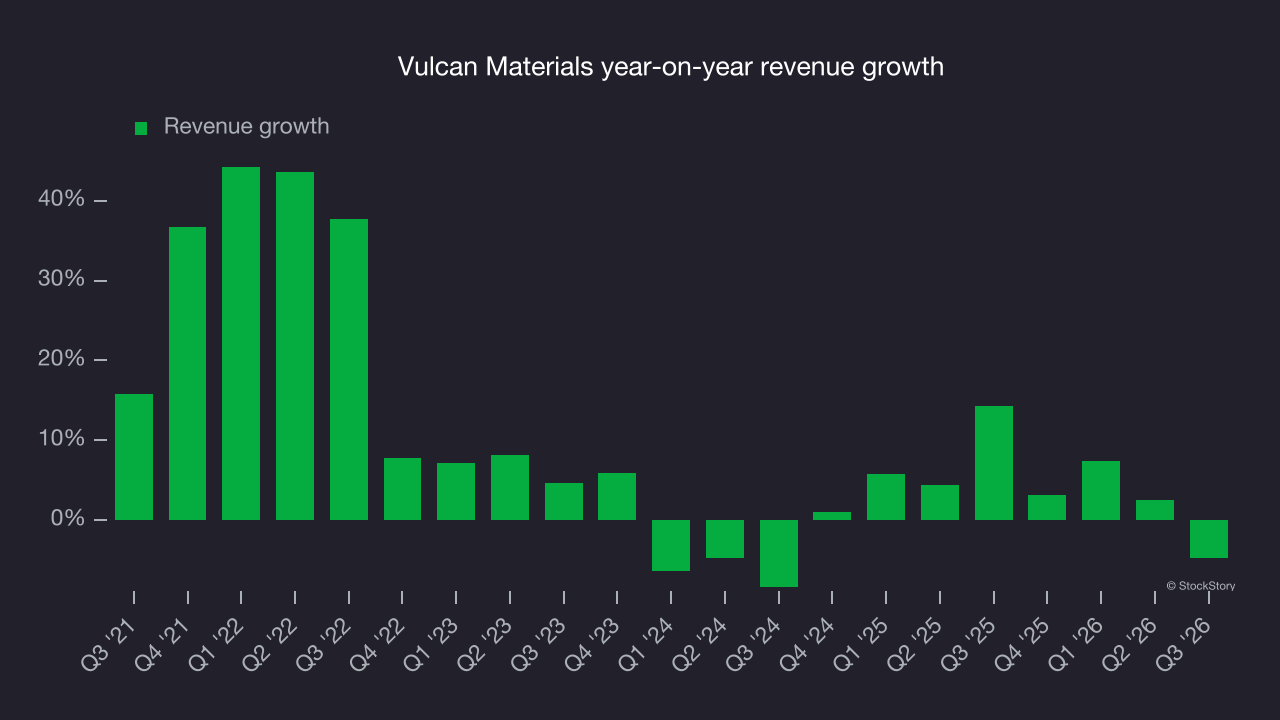
The company’s revenue dynamics become clearer by analyzing its number of tons shipped, which reached 22.84 million in the latest quarter. Over the last two years, Vulcan Materials’s tons shipped averaged 6.2% year-on-year declines. Revenue growth outpaced this metric during the same period, indicating that the company’s monetization has risen. 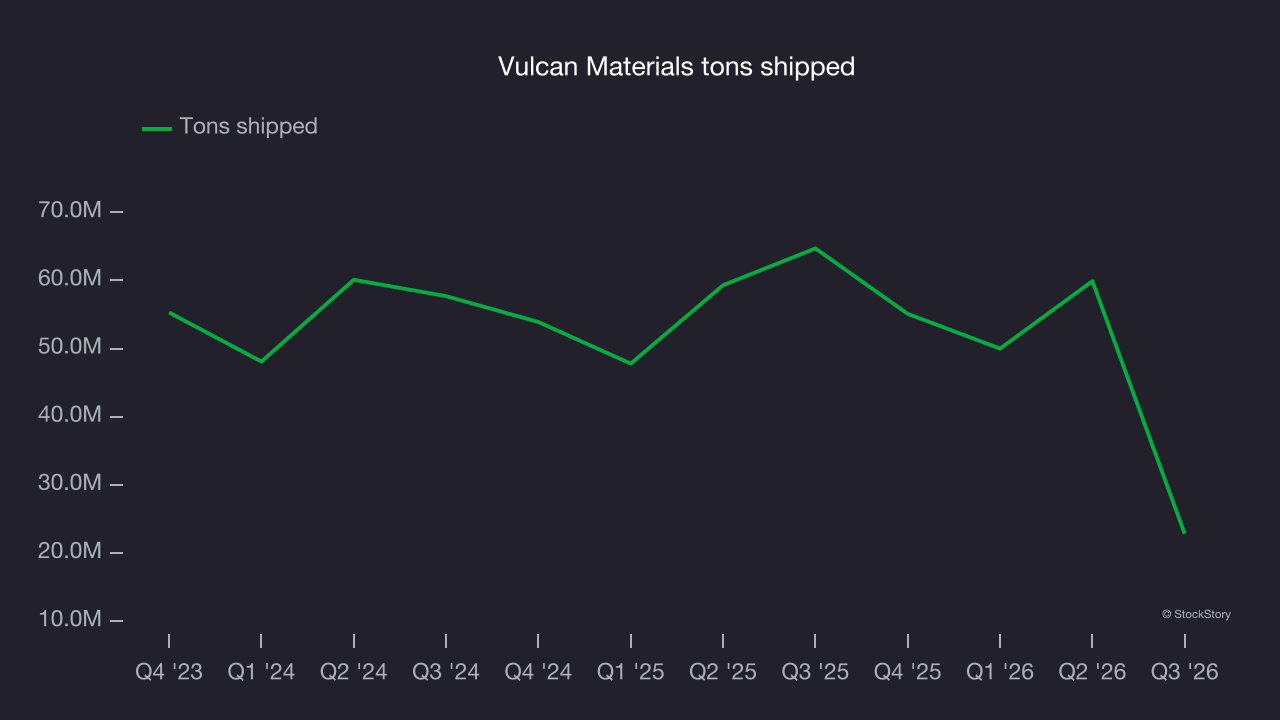
This quarter, Vulcan Materials missed Wall Street’s consensus estimates and reported an uninspiring 4.7% year-on-year revenue decline, generating $2.18 billion of revenue.
Looking ahead, sell-side analysts expect revenue to grow 4.5% over the next 12 months, according to S&P, similar to its two-year rate. This projection is underwhelming and implies its newer products and services will not lead to better top-line performance yet. At least the company is tracking well in other measures of financial health.
Operating margin
Vulcan Materials has performed well over the last five years. It demonstrated strong profitability for an industrials business, with an average operating margin of 17.9%. That outcome is unsurprising given its favorable gross margin baseline.
Looking at the trend in its profitability, Vulcan Materials’s operating margin rose by 6.8 percentage points over the last five years, as its revenue growth provided substantial operating leverage.
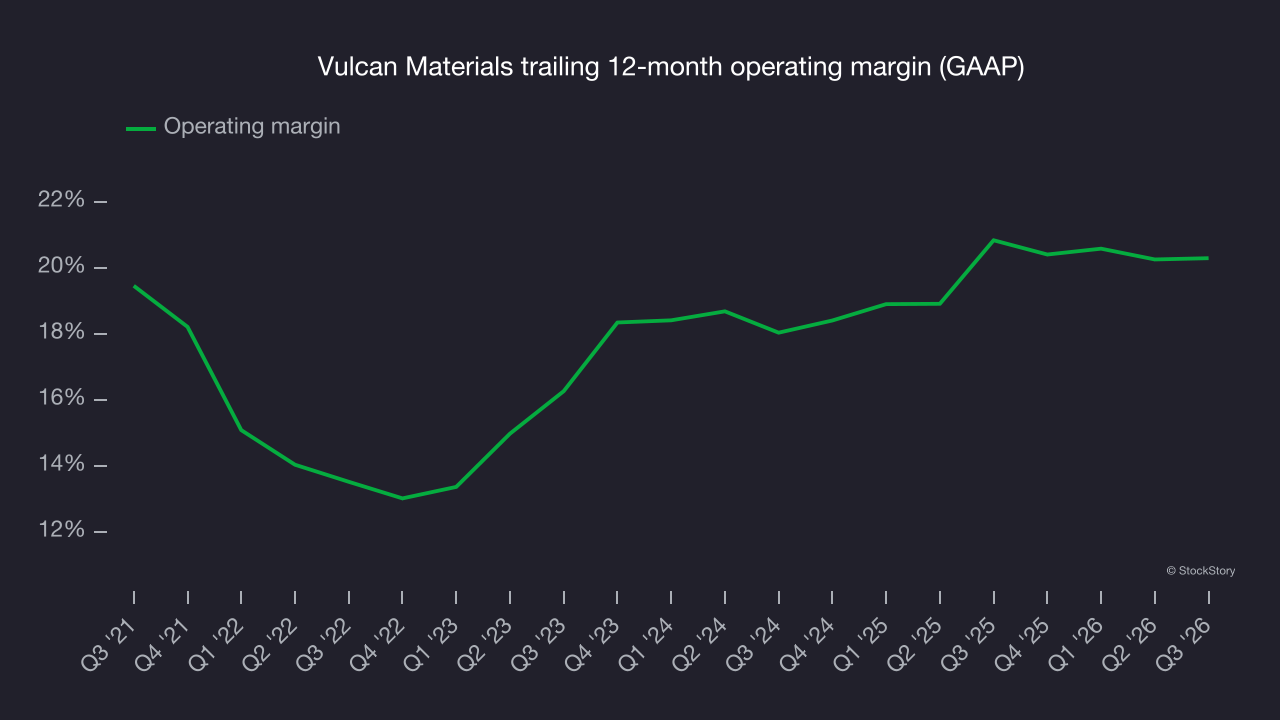
In Q3, Vulcan Materials generated an operating margin of 24%, in line with the same quarter last year. This indicates the company’s cost structure has recently been stable.
Earnings per share
We track the long-term change in earnings per share (EPS) for the same reason as long-term revenue growth. Compared to revenue, however, EPS highlights whether a company’s growth is profitable.
Vulcan Materials’s EPS grew at an 11.7% compounded annual growth rate over the last five years, higher than its 9.4% annualized revenue growth. This tells us the company became more profitable on a per-share basis as it expanded.
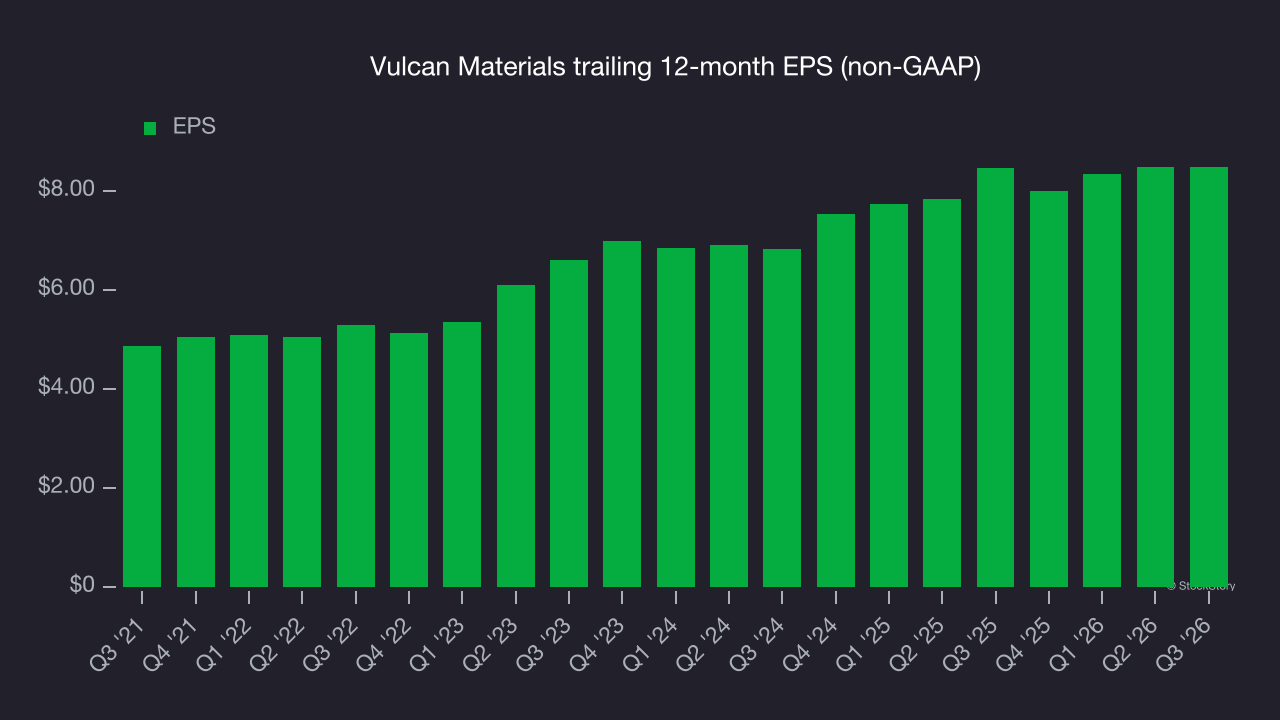
We can take a deeper look into Vulcan Materials’s earnings to better understand the drivers of its performance. As we mentioned earlier, Vulcan Materials’s operating margin was flat this quarter but expanded by 6.8 percentage points over the last five years. On top of that, its share count shrank by 3%. These are positive signs for shareholders because improving profitability and share buybacks boost EPS growth relative to revenue growth. 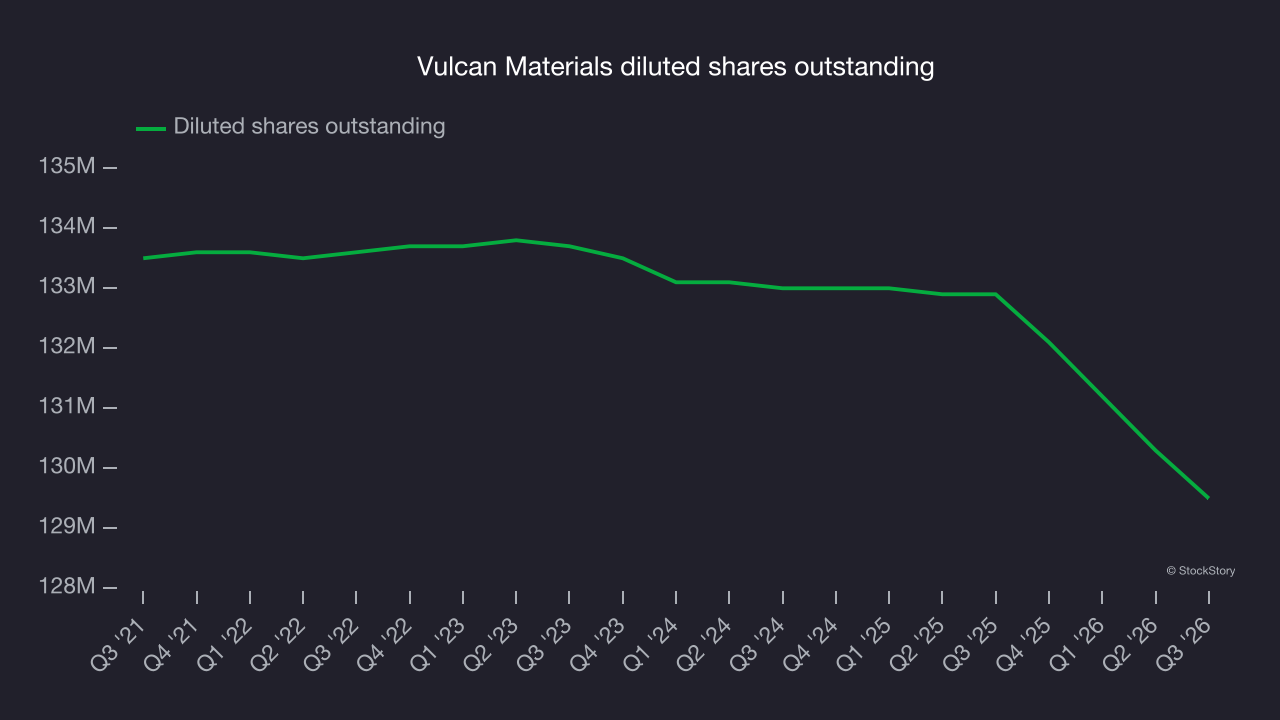
Like with revenue, we analyze EPS over a shorter period to see if we are missing a change in the business.
For Vulcan Materials, its two-year annual EPS growth of 11.4% is similar to its five-year trend, implying strong and stable earnings power.
In Q3, Vulcan Materials reported adjusted EPS of $2.83, down from $2.84 in the same quarter last year. This result was close to analysts’ consensus estimates. Over the next 12 months, Wall Street expects Vulcan Materials’s full-year EPS to grow 13.8% from $8.47 to $9.64, according to S&P.
Key takeaways from Vulcan Materials’s Q3 results
Vulcan Materials’ revenue miss left room for improvement this quarter, even with full-year EBITDA guidance in line with analysts’ consensus estimates. Shares edged lower 1.6% to $260.76 immediately after the report.
Vulcan Materials’s latest earnings report disappointed. One quarter doesn’t define a company’s quality or determine whether the stock is a buy at the current price. That decision requires a broader look at valuation, business quality and the latest earnings. For more on Vulcan Materials, read the full research report here (it’s free).