Vertically integrated manufacturing solutions provider Mayville Engineering Company (NYSE: MEC) missed Wall Street’s revenue expectations in Q2 CY2025, with sales falling 19.1% year on year to $132.3 million. The company’s full-year revenue guidance of $545 million at the midpoint came in 8.4% below analysts’ estimates. Its non-GAAP profit of $0.10 per share was 67.4% above analysts’ consensus estimates.
Is now the time to buy Mayville Engineering? Find out by accessing our full research report, it’s free.
Mayville Engineering (MEC) Q2 CY2025 Highlights:
- Revenue: $132.3 million vs analyst estimates of $138 million (19.1% year-on-year decline, 4.1% miss)
- Adjusted EPS: $0.10 vs analyst estimates of $0.06 (67.4% beat)
- Adjusted EBITDA: $13.68 million vs analyst estimates of $13.38 million (10.3% margin, 2.2% beat)
- The company dropped its revenue guidance for the full year to $545 million at the midpoint from $575 million, a 5.2% decrease
- EBITDA guidance for the full year is $52 million at the midpoint, below analyst estimates of $63.81 million
- Operating Margin: 0.1%, down from 5% in the same quarter last year
- Free Cash Flow Margin: 9.5%, down from 11.7% in the same quarter last year
- Market Capitalization: $336.6 million
Company Overview
Originally founded solely on tool and die manufacturing, Mayville Engineering Company (NYSE: MEC) specializes in metal fabrication, tube bending, and welding to be used in various industries.
Revenue Growth
A company’s long-term sales performance can indicate its overall quality. Any business can put up a good quarter or two, but the best consistently grow over the long haul. Over the last five years, Mayville Engineering grew its sales at a tepid 5.5% compounded annual growth rate. This was below our standard for the industrials sector and is a rough starting point for our analysis.
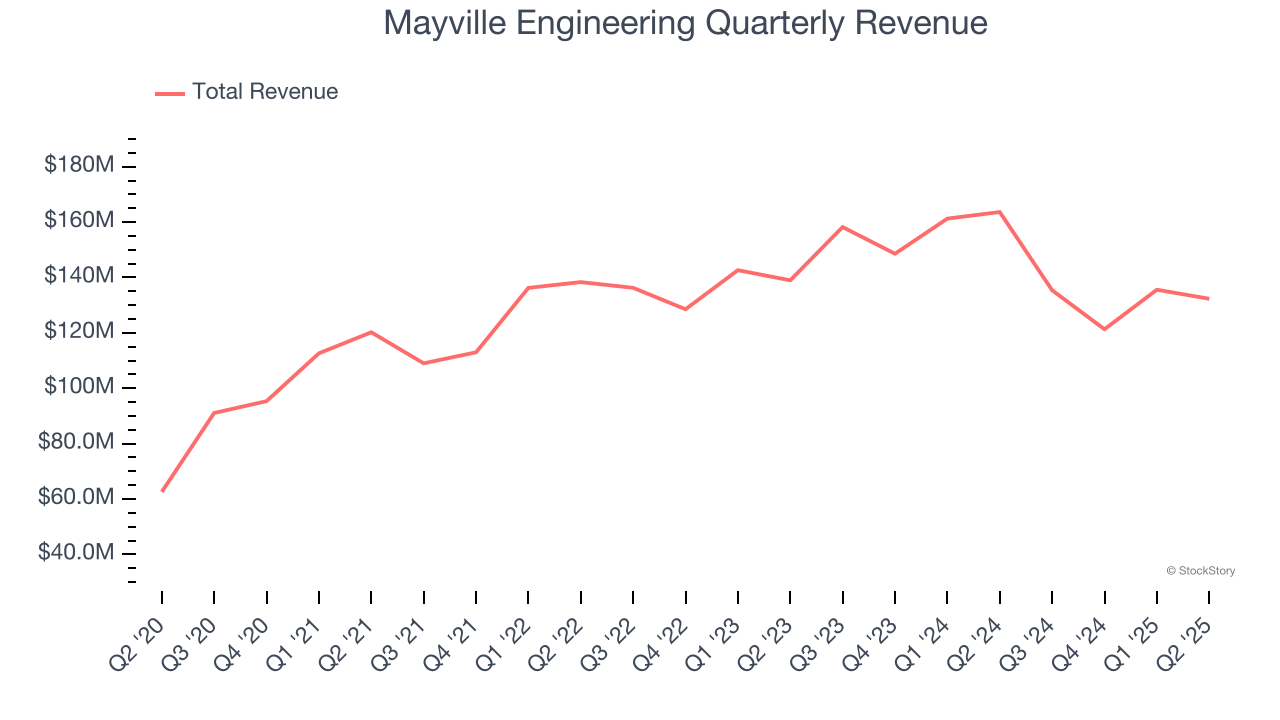
We at StockStory place the most emphasis on long-term growth, but within industrials, a half-decade historical view may miss cycles, industry trends, or a company capitalizing on catalysts such as a new contract win or a successful product line. Mayville Engineering’s performance shows it grew in the past but relinquished its gains over the last two years, as its revenue fell by 2% annually. 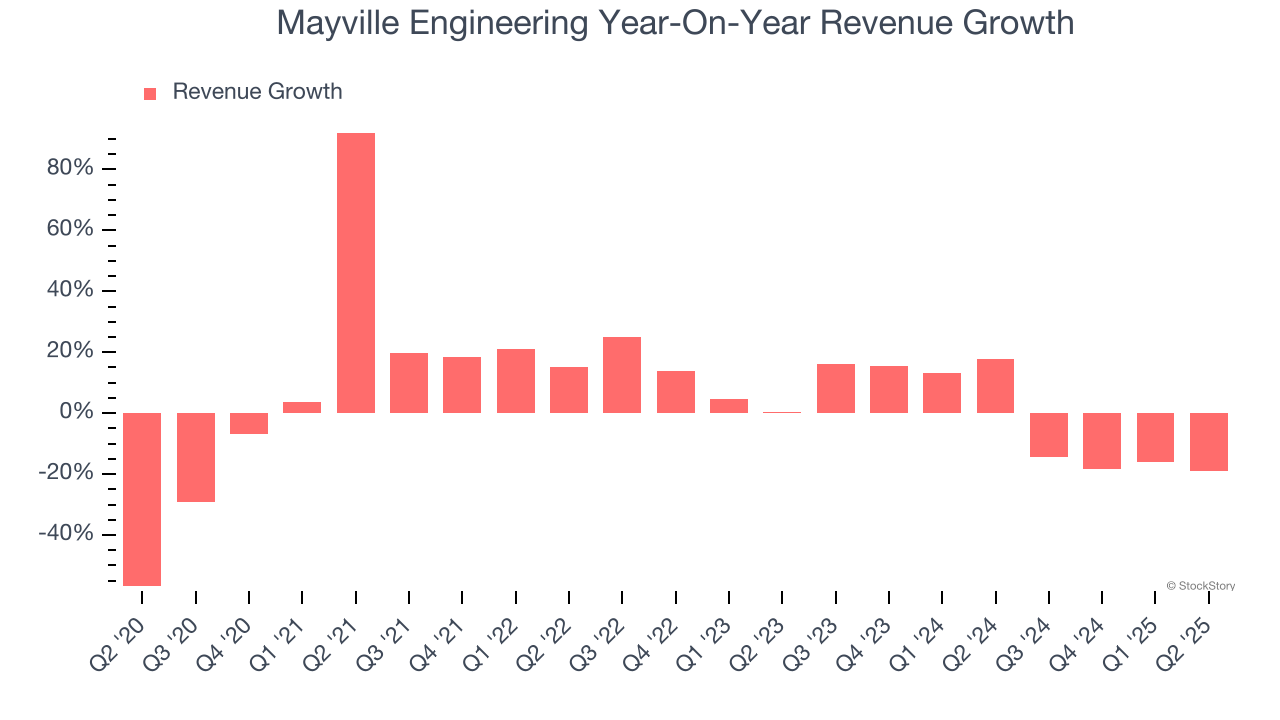
We can dig further into the company’s revenue dynamics by analyzing its most important segments, Commercial Vehicle and Construction & Access, which are 37.1% and 15.2% of revenue. Over the last two years, Mayville Engineering’s Commercial Vehicle revenue (exhaust, engine components, fuel systems) averaged 4.9% year-on-year declines while its Construction & Access revenue (fenders, hoods, frames for heavy machinery) averaged 13.2% declines. 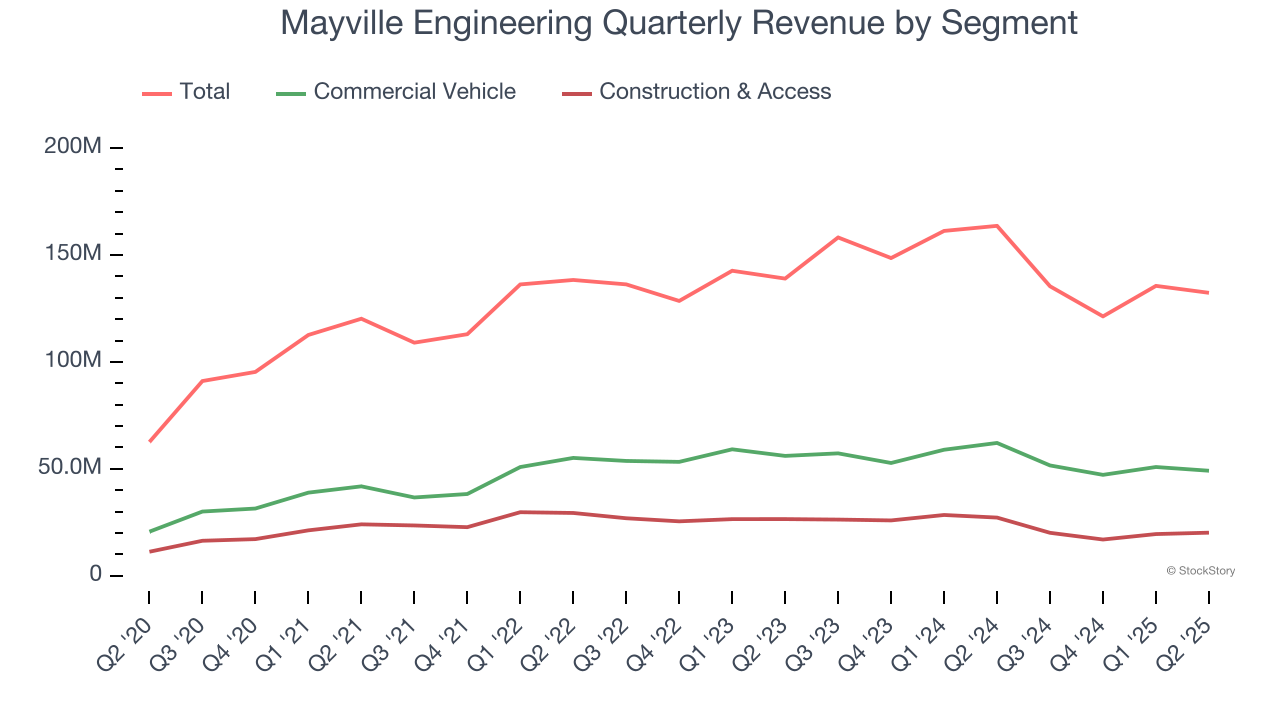
This quarter, Mayville Engineering missed Wall Street’s estimates and reported a rather uninspiring 19.1% year-on-year revenue decline, generating $132.3 million of revenue.
Looking ahead, sell-side analysts expect revenue to grow 22% over the next 12 months, an improvement versus the last two years. This projection is eye-popping and indicates its newer products and services will catalyze better top-line performance.
Unless you’ve been living under a rock, it should be obvious by now that generative AI is going to have a huge impact on how large corporations do business. While Nvidia and AMD are trading close to all-time highs, we prefer a lesser-known (but still profitable) stock benefiting from the rise of AI. Click here to access our free report one of our favorites growth stories.
Operating Margin
Operating margin is an important measure of profitability as it shows the portion of revenue left after accounting for all core expenses – everything from the cost of goods sold to advertising and wages. It’s also useful for comparing profitability across companies with different levels of debt and tax rates because it excludes interest and taxes.
Mayville Engineering was profitable over the last five years but held back by its large cost base. Its average operating margin of 3.3% was weak for an industrials business. This result isn’t too surprising given its low gross margin as a starting point.
On the plus side, Mayville Engineering’s operating margin rose by 3.5 percentage points over the last five years, as its sales growth gave it operating leverage.
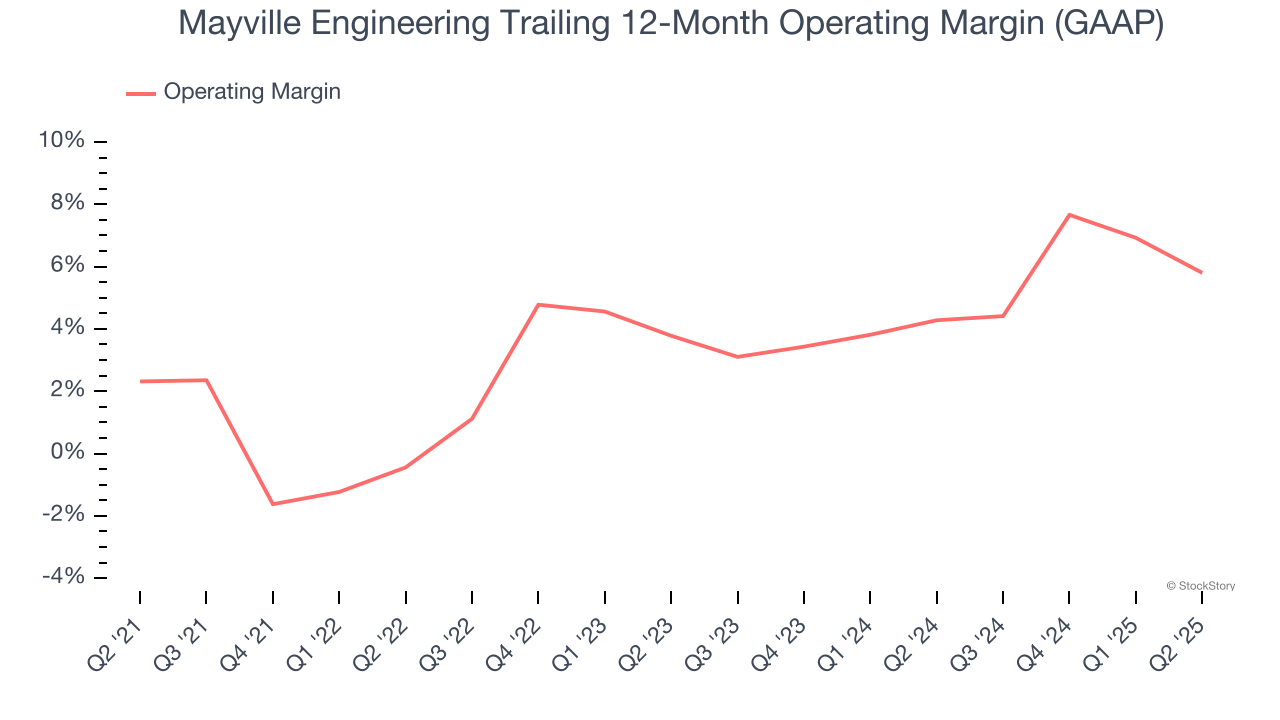
In Q2, Mayville Engineering’s breakeven margin was down 4.9 percentage points year on year. Since Mayville Engineering’s operating margin decreased more than its gross margin, we can assume it was less efficient because expenses such as marketing, R&D, and administrative overhead increased.
Earnings Per Share
Revenue trends explain a company’s historical growth, but the long-term change in earnings per share (EPS) points to the profitability of that growth – for example, a company could inflate its sales through excessive spending on advertising and promotions.
Mayville Engineering’s full-year EPS flipped from negative to positive over the last five years. This is encouraging and shows it’s at a critical moment in its life.
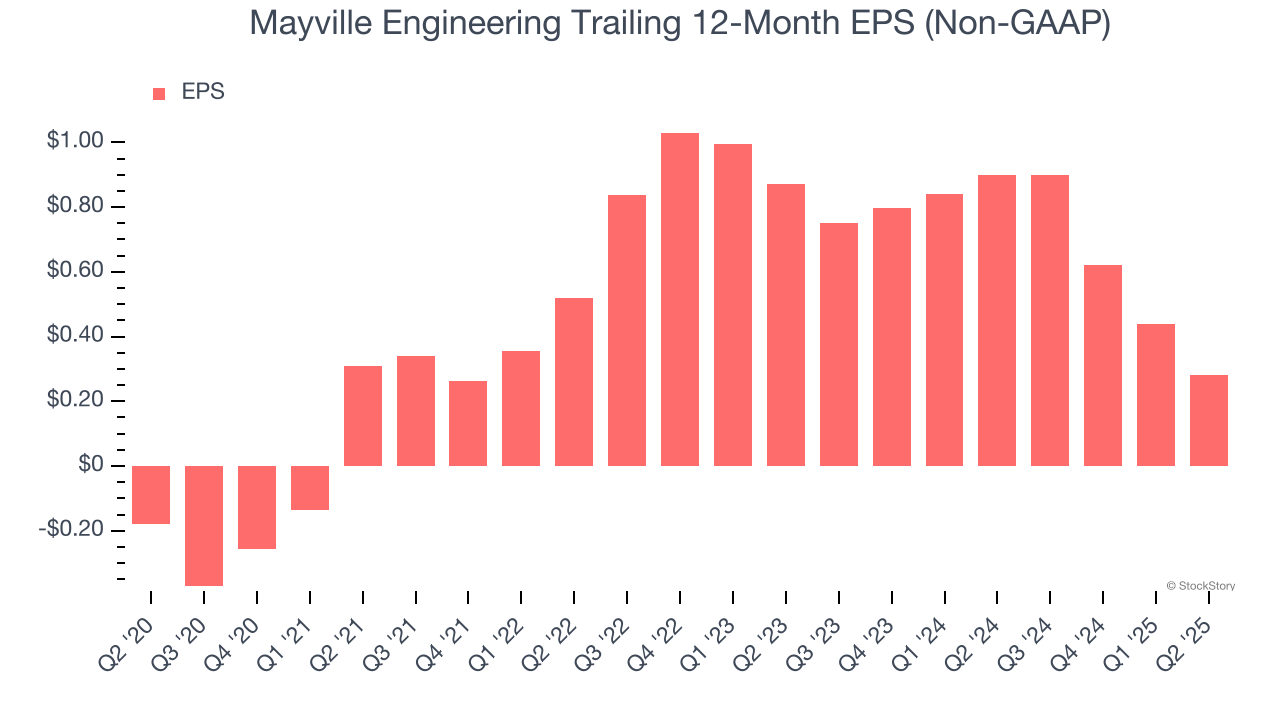
Like with revenue, we analyze EPS over a shorter period to see if we are missing a change in the business.
Sadly for Mayville Engineering, its EPS declined by more than its revenue over the last two years, dropping 43.3%. This tells us the company struggled to adjust to shrinking demand.
We can take a deeper look into Mayville Engineering’s earnings to better understand the drivers of its performance. Mayville Engineering’s operating margin has declined by 3 percentage points over the last two years. This was the most relevant factor (aside from the revenue impact) behind its lower earnings; interest expenses and taxes can also affect EPS but don’t tell us as much about a company’s fundamentals.
In Q2, Mayville Engineering reported adjusted EPS at $0.10, down from $0.26 in the same quarter last year. Despite falling year on year, this print easily cleared analysts’ estimates. Over the next 12 months, Wall Street expects Mayville Engineering’s full-year EPS of $0.28 to grow 240%.
Key Takeaways from Mayville Engineering’s Q2 Results
We were impressed by how significantly Mayville Engineering blew past analysts’ EPS expectations this quarter. We were also happy its EBITDA outperformed Wall Street’s estimates. On the other hand, its Commercial Vehicle revenue missed and its full-year revenue guidance fell short of Wall Street’s estimates. Overall, this was a weaker quarter. The stock traded down 7.8% to $15.40 immediately following the results.
The latest quarter from Mayville Engineering’s wasn’t that good. One earnings report doesn’t define a company’s quality, though, so let’s explore whether the stock is a buy at the current price. We think that the latest quarter is only one piece of the longer-term business quality puzzle. Quality, when combined with valuation, can help determine if the stock is a buy. We cover that in our actionable full research report which you can read here, it’s free.