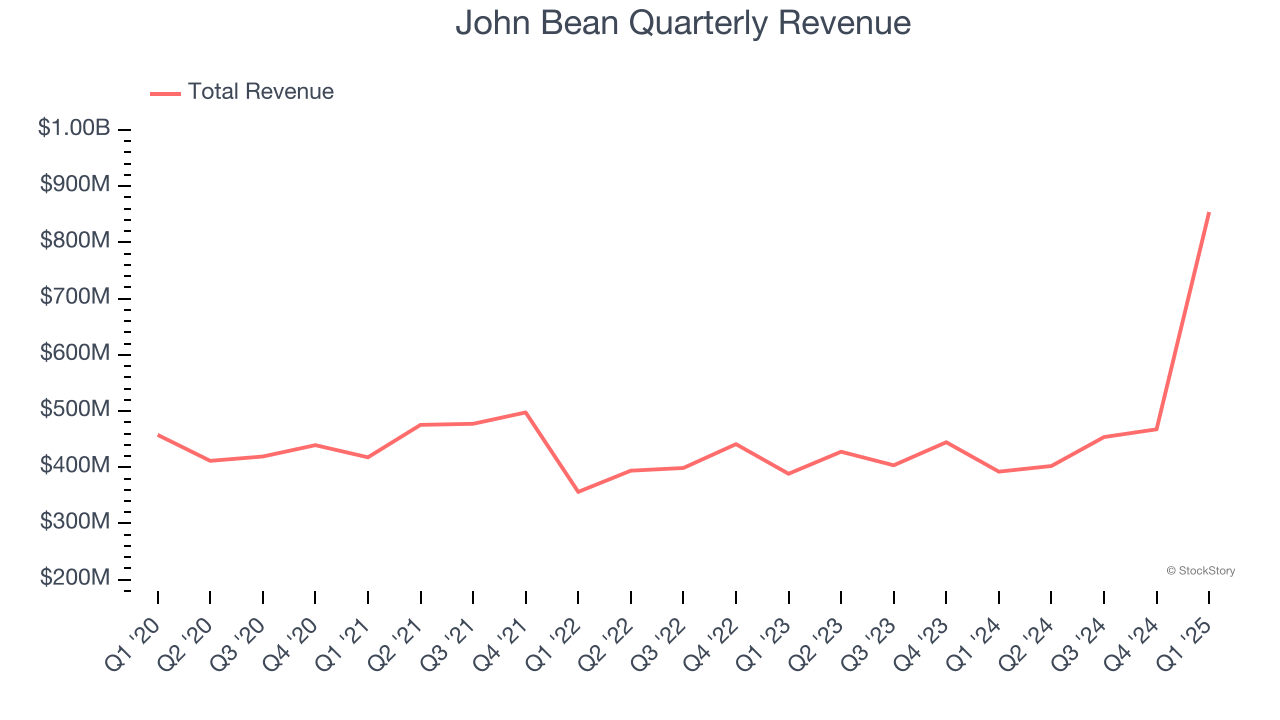
Food processing and aviation equipment manufacturer John Bean (NYSE: JBT) reported Q1 CY2025 results beating Wall Street’s revenue expectations, with sales up 118% year on year to $854.1 million. Guidance for next quarter’s revenue was optimistic at $900 million at the midpoint, 2.8% above analysts’ estimates. Its non-GAAP profit of $0.97 per share was 15.8% above analysts’ consensus estimates.
Is now the time to buy John Bean? Find out by accessing our full research report, it’s free.
John Bean (JBTM) Q1 CY2025 Highlights:
- Revenue: $854.1 million vs analyst estimates of $832.4 million (118% year-on-year growth, 2.6% beat)
- Adjusted EPS: $0.97 vs analyst estimates of $0.84 (15.8% beat)
- Adjusted EBITDA: $112.2 million vs analyst estimates of $102.5 million (13.1% margin, 9.5% beat)
- Revenue Guidance for Q2 CY2025 is $900 million at the midpoint, above analyst estimates of $875.5 million
- Adjusted EPS guidance for Q2 CY2025 is $1.30 at the midpoint, above analyst estimates of $1.22
- Operating Margin: -3.9%, down from 7.4% in the same quarter last year
- Free Cash Flow Margin: 1.7%, up from 0.2% in the same quarter last year
- Backlog: $1.3 billion at quarter end
- Market Capitalization: $5.57 billion
"JBT Marel had a solid start to the year as we outperformed our first quarter expectations," said Brian Deck, Chief Executive Officer.
Company Overview
Tracing back to its invention of the mechanical milk bottle filler in 1884, John Bean (NYSE: JBT) designs, manufactures, and sells equipment used for food processing and aviation.
Sales Growth
Examining a company’s long-term performance can provide clues about its quality. Any business can experience short-term success, but top-performing ones enjoy sustained growth for years. Unfortunately, John Bean’s 1.9% annualized revenue growth over the last five years was sluggish. This fell short of our benchmarks and is a poor baseline for our analysis.
We at StockStory place the most emphasis on long-term growth, but within industrials, a half-decade historical view may miss cycles, industry trends, or a company capitalizing on catalysts such as a new contract win or a successful product line. John Bean’s annualized revenue growth of 15.9% over the last two years is above its five-year trend, suggesting its demand recently accelerated. 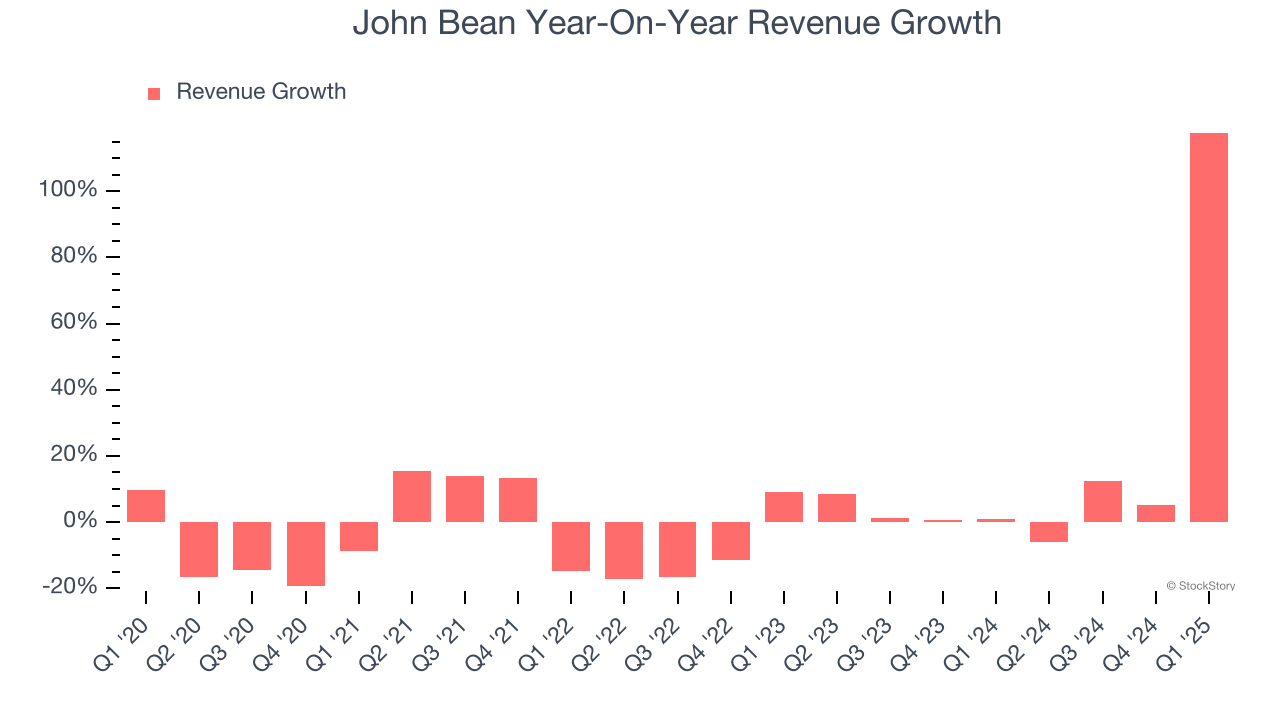
This quarter, John Bean reported magnificent year-on-year revenue growth of 118%, and its $854.1 million of revenue beat Wall Street’s estimates by 2.6%. Company management is currently guiding for a 124% year-on-year increase in sales next quarter.
Looking further ahead, sell-side analysts expect revenue to grow 67.1% over the next 12 months, an improvement versus the last two years. This projection is eye-popping and suggests its newer products and services will spur better top-line performance.
Today’s young investors won’t have read the timeless lessons in Gorilla Game: Picking Winners In High Technology because it was written more than 20 years ago when Microsoft and Apple were first establishing their supremacy. But if we apply the same principles, then enterprise software stocks leveraging their own generative AI capabilities may well be the Gorillas of the future. So, in that spirit, we are excited to present our Special Free Report on a profitable, fast-growing enterprise software stock that is already riding the automation wave and looking to catch the generative AI next.
Operating Margin
John Bean was profitable over the last five years but held back by its large cost base. Its average operating margin of 7.4% was weak for an industrials business. This result is surprising given its high gross margin as a starting point.
Analyzing the trend in its profitability, John Bean’s operating margin decreased by 6.7 percentage points over the last five years. This raises questions about the company’s expense base because its revenue growth should have given it leverage on its fixed costs, resulting in better economies of scale and profitability. John Bean’s performance was poor no matter how you look at it - it shows that costs were rising and it couldn’t pass them onto its customers.
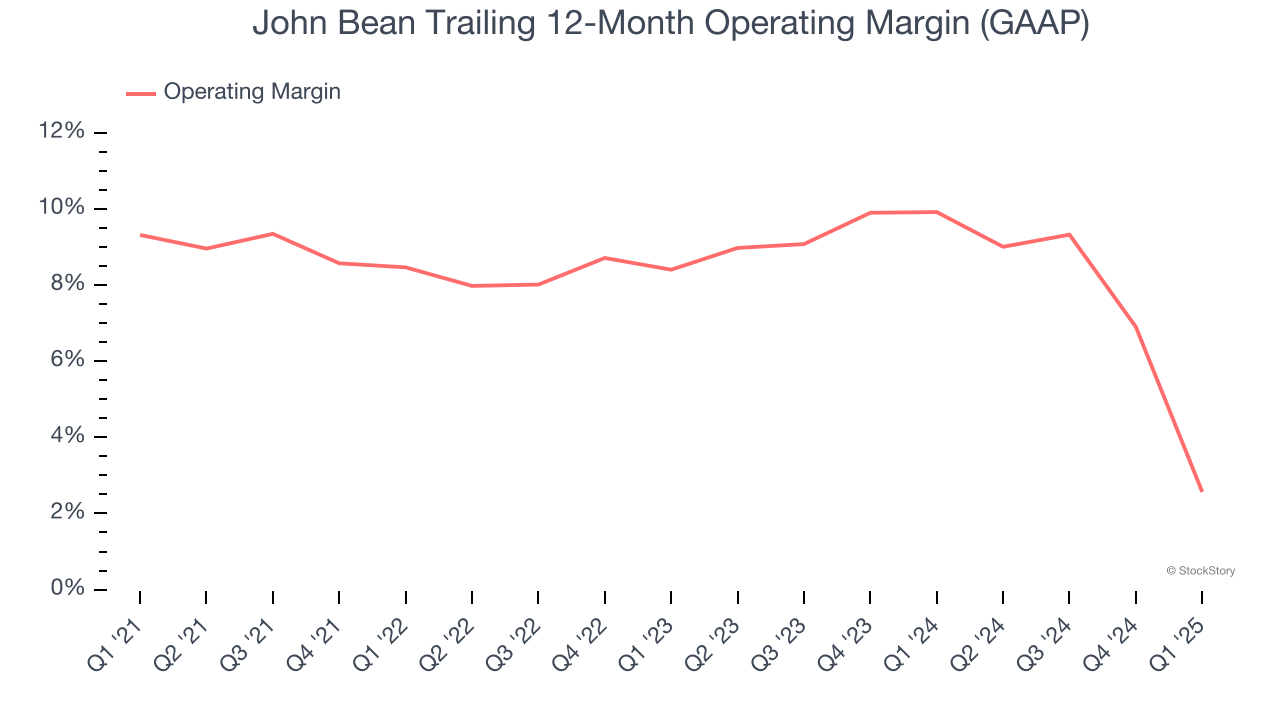
In Q1, John Bean generated an operating profit margin of negative 3.9%, down 11.3 percentage points year on year. Since John Bean’s operating margin decreased more than its gross margin, we can assume it was less efficient because expenses such as marketing, R&D, and administrative overhead increased.
Earnings Per Share
We track the long-term change in earnings per share (EPS) for the same reason as long-term revenue growth. Compared to revenue, however, EPS highlights whether a company’s growth is profitable.
John Bean’s flat EPS over the last five years was below its 1.9% annualized revenue growth. This tells us the company became less profitable on a per-share basis as it expanded.
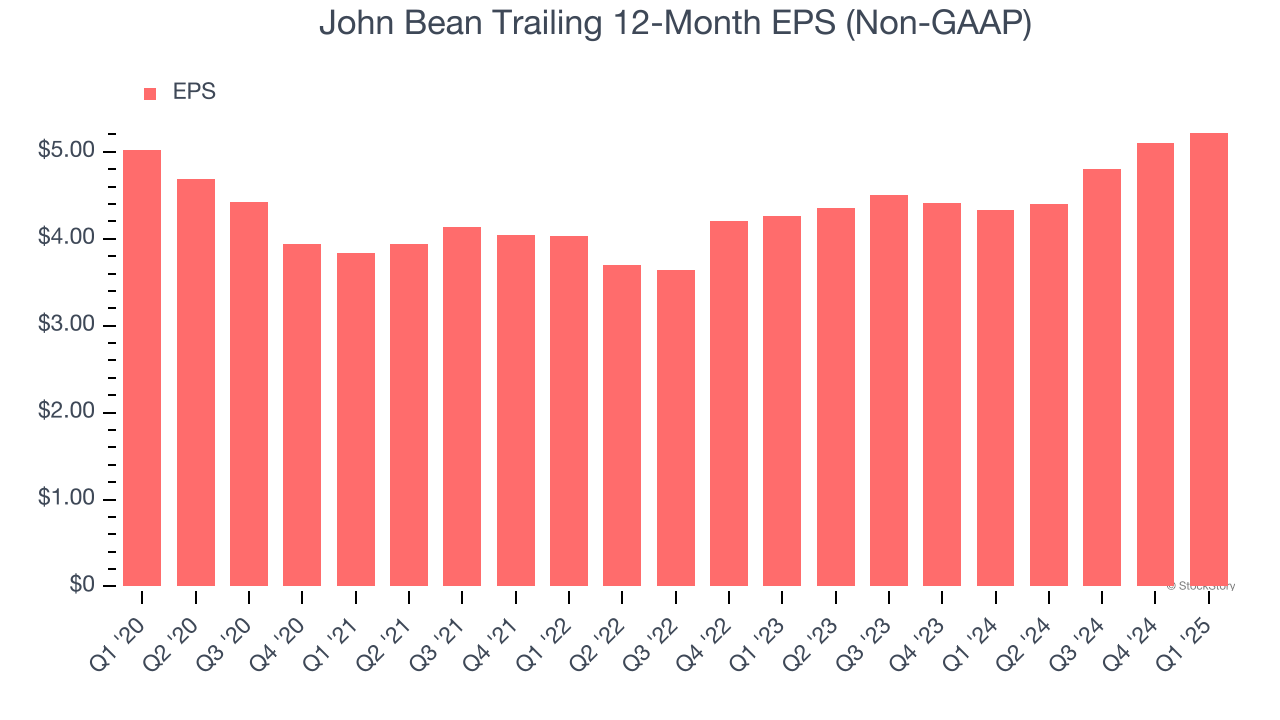
We can take a deeper look into John Bean’s earnings to better understand the drivers of its performance. As we mentioned earlier, John Bean’s operating margin declined by 6.7 percentage points over the last five years. Its share count also grew by 61.1%, meaning the company not only became less efficient with its operating expenses but also diluted its shareholders. 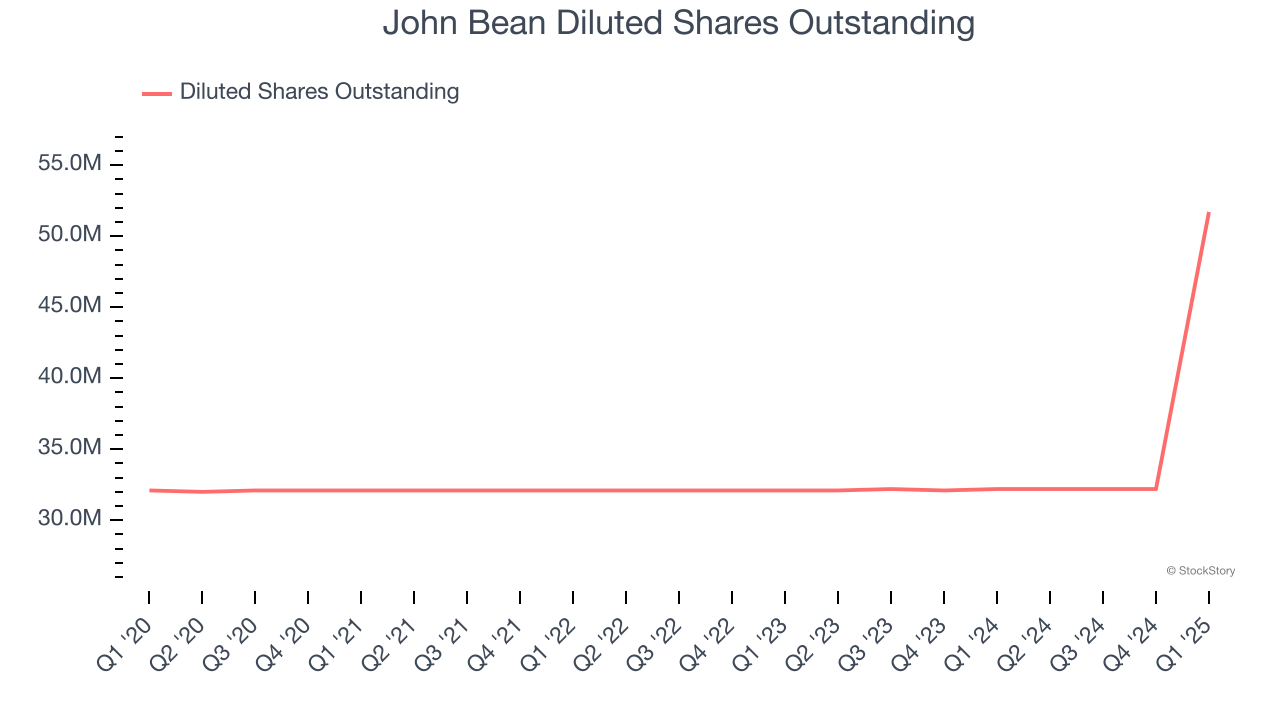
Like with revenue, we analyze EPS over a shorter period to see if we are missing a change in the business.
For John Bean, its two-year annual EPS growth of 10.7% was higher than its five-year trend. This acceleration made it one of the faster-growing industrials companies in recent history.
In Q1, John Bean reported EPS at $0.97, up from $0.85 in the same quarter last year. This print easily cleared analysts’ estimates, and shareholders should be content with the results. Over the next 12 months, Wall Street expects John Bean’s full-year EPS of $5.22 to grow 18.6%.
Key Takeaways from John Bean’s Q1 Results
We were impressed by how significantly John Bean blew past analysts’ revenue, EPS, and EBITDA expectations this quarter. We were also glad its revenue and EPS guidance for next quarter exceeded Wall Street’s estimates. Zooming out, we think this was a solid print. The stock traded up 1.7% to $109 immediately following the results.
John Bean had an encouraging quarter, but one earnings result doesn’t necessarily make the stock a buy. Let’s see if this is a good investment. If you’re making that decision, you should consider the bigger picture of valuation, business qualities, as well as the latest earnings. We cover that in our actionable full research report which you can read here, it’s free.