Toronto, Ontario--(Newsfile Corp. - August 25, 2025) - Omai Gold Mines Corp. (TSXV: OMG) (OTCQB: OMGGF) ("Omai Gold" or the "Company") is pleased to report an updated Mineral Resource Estimate ("MRE") on its 100%-owned Omai Gold Property in Guyana. The MRE includes an expansion to the Wenot Deposit and incorporates the previously disclosed Gilt Creek Deposit. Most significantly, for the Wenot Mineral Resource Estimate ("MRE"), the Inferred MRE increased 130% to 3,717,000 oz grading 1.82 g/t Au, contained in 63.4 million tonnes (“Mt”), and the Indicated MRE increased 16% to 970,000 oz grading 1.46 g/t Au, contained in 20.7 Mt.
HIGHLIGHTS:
The Omai Property hosts two orogenic gold deposits: the shear-hosted Wenot Deposit and the adjacent intrusive-hosted Gilt Creek Deposit (Figure 1), with a combined updated MRE (over the February 2024 MRE) of:
2,121,000 ounces of gold (Indicated MRE), a 7% increase, averaging 2.07 g/t Au in 31.9Mt &
4,382,000 ounces of gold (Inferred MRE), a 92% increase, averaging 1.95 g/t Au in 69.6Mt
Wenot Deposit (a constrained pit and underground approach is applied)
- 970,000 oz of gold in 20.7Mt (Indicated), a 16% increase in ounces over the Feb 2024 MRE
- 3,717,000 oz of gold in 63.4Mt (Inferred), a 130% increase in ounces
- 1.46 g/t Au grade of Indicated MRE, a 1.4% decrease*
- 1.82 g/t Au grade of Inferred MRE, an 8.5% decrease*
- *Increased gold price assumption to $2,500/oz from $1,850/oz allowed cutoff lower to 0.30 g/t Au from 0.35 g/t Au, resulting in lower average grades however increased ounces
- ~60% above 350m depth from surface (Figure 2a)
- ~30% of Wenot MRE is west of the historical open pit, an area considered to be well suited to initial mining (Figure 2b)
- Expansion potential is evident along a minimum 2.5 km length of the host Wenot shear corridor, including within, adjacent to, below, and along strike
Gilt Creek Deposit (an underground mining approach is applied)
- 1,151,000 ounces of gold (Indicated) averaging 3.22 g/t Au, in 11.1Mt (Feb 2024 MRE)
- 665,000 ounces of gold (Inferred) averaging 3.35 g/t Au, in 6.2Mt (Feb 2024 MRE)
- Hosted within a 500m by 300m quartz diorite intrusive "Omai stock" that produced 2.4 million ounces of gold (1993 to 2005) from the upper 250m
- Located 500m north of the Wenot Deposit and below the past-producing Fennel open pit
- Characterized by very wide sub-horizontal zones of gold mineralization (Figure 5)
- Open to depth and holds demonstrated potential for lateral expansion
Elaine Ellingham, President & CEO commented, "We are pleased to be delivering yet another very substantial increase to the Mineral Resource Estimate for our Omai Gold Project in Guyana. This firmly positions Omai as one of the top two largest gold projects in Guyana. Omai has many benefits as a brownfields project, not the least of which is road access (mostly paved), an airstrip, a cleared site, established tailings sites and known past production parameters. In addition to these clear advantages, Guyana has proven to be a favourable jurisdiction, now recognized by the Fraser Institute as the 9th best jurisdiction for mining investment in the world, with a Government and people that are supportive of large-scale mine development. This updated Mineral Resource Estimate reinforces the potential for accelerated large-scale mine re-development at Omai, a project that continues to deliver superior value creation for all stakeholders. With each successive milestone it becomes clearer that Omai has the potential to be a multi-decade world-class gold mining operation.
Notwithstanding this large gold Mineral Resource Estimate we announced today, we still see very significant potential to further expand the gold zones at both the Wenot and the Gilt Creek Deposits. We will continue to aggressively drill to increase these Mineral Resources and to upgrade the Inferred Mineral Resource Estimate, in order to advance the project towards a Feasibility Study later in 2026. Two drills are currently turning on nearby known gold occurrences, exploring for near-surface satellite deposits, while the third drill continues on a deep hole (25ODD-122) that drilled across the Gilt Creek Deposit and continues, with the goal of testing the blue sky depth potential of the adjacent Wenot Deposit."
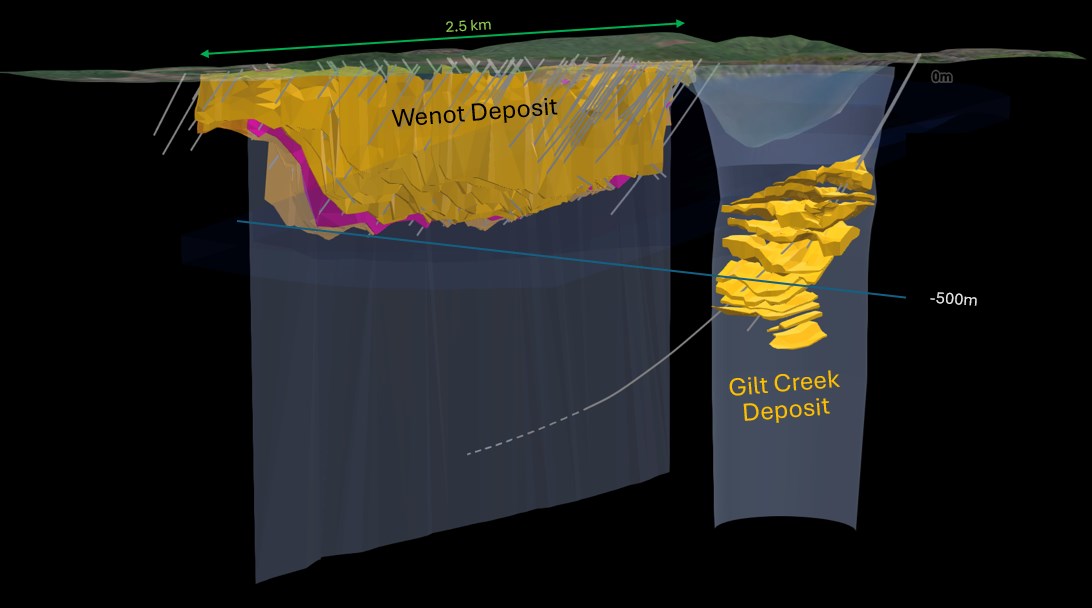
Figure 1. 3D Model of Wenot Shear-Hosted Deposit and Gilt Creek Intrusion-Hosted Deposit
To view an enhanced version of this graphic, please visit:
https://images.newsfilecorp.com/files/8712/263731_7c6565f1f490ebe2_001full.jpg
Details of the Mineral Resource Estimate for both the Wenot (updated) and Gilt Creek Deposits are presented in Table 1. The increase in the updated Wenot MRE over the previous February 2024 MRE is detailed in a comparison in Table 2. Notes accompanying the 2025 MRE are shown below Table 2, summarizing the economic and technical assumptions, which include a gold price of US$2,500 per ounce and metallurgical recoveries of 92% (consistent with historical actuals).
Table 1. 2025 (August) Mineral Resource Estimates
| Indicated Resources | Inferred Resources | ||||||||
| Resource Area | Mining Method | Tonnes (k) | Au (g/t) | Au (koz) | Tonnes (k) | Au (g/t) | Au (koz) | ||
| GILT CREEK (1.5 g/t Cut-Off) | Underground | 11,123 | 3.22 | 1,151 | 6,186 | 3.35 | 665 | ||
| WENOT Pit (0.20 & 0.30 g/t Cut-Off) | Open Pit | 20,713 | 1.46 | 969 | 62,299 | 1.78 | 3,565 | ||
| WENOT Out-of Pit (1.5 g/t Cut-Off) | Underground | 16 | 2.14 | 1 | 1,147 | 4.13 | 152 | ||
| Total Mineral Resource Estimate | 31,852 | 2.07 | 2,121 | 69,632 | 1.95 | 4,382 | |||
Wenot Pit-Constrained Mineral Resource Estimate by Mineralization Type | |||||||||
| WENOT | Saprolite & Alluvium | Open Pit 0.20 g/t Cut-Off | 1,819 | 0.94 | 55 | 417 | 1.69 | 23 | |
| Fresh Rock & Transition | Open Pit 0.30 g/t Cut-Off | 18,894 | 1.51 | 914 | 61,882 | 1.78 | 3,542 | ||
Table 2. Comparison between Wenot 2025 (August) MRE and 2024 (February) MRE
| Tonnes (k) | Au (g/t) | Au (koz) | |||||||
| Category | 2024 MRE | 2025 MRE | Change (%) | 2024 MRE | 2025 MRE | Change (%) | 2024 MRE | 2025 MRE | Change (%) |
| Indicated | 17,572 | 20,729 | +18 | 1.48 | 1.46 | -1.4 | 834 | 970 | +16 |
| Inferred | 25,183 | 63,446 | +152 | 1.99 | 1.82 | -8.5 | 1,614 | 3,717 | +130 |
Notes to Accompany the August 2025 Mineral Resource Estimate:
- Mineral Resources that are not Mineral Reserves do not have demonstrated economic viability.
- The estimate of Mineral Resources may be materially affected by environmental, permitting, legal, title, taxation, socio-political, marketing, or other relevant issues.
- The Inferred Mineral Resource in this estimate has a lower level of confidence than that applied to an Indicated Mineral Resource and must not be converted to a Mineral Reserve. It is reasonably expected that the majority of the Inferred Mineral Resource could potentially be upgraded to an Indicated Mineral Resource with continued exploration.
- The Mineral Resources were estimated in accordance with the Canadian Institute of Mining, Metallurgy and Petroleum (CIM), CIM Standards on Mineral Resources and Reserves, Definitions (2014) and Best Practices Guidelines (2019) prepared by the CIM Standing Committee on Reserve Definitions and adopted by the CIM Council.
- Wenot wireframe constrained gold assays were composited to 1.5 metre lengths and subsequently capped between 7 to 28 g/t. Gilt Creek Wireframe constrained gold assays were composited to 1.0 metre lengths and subsequently capped between 12 to 40 g/t.
- The Wenot Mineral Resource Estimate incorporates 12,028 assay results from 639 diamond drill holes totalling 110,920 m within the mineralized wireframes. The Gilt Creek Mineral Resource Estimate incorporates 7,056 assay results from 46 diamond drill holes totalling 27,997 m within the mineralized wireframes.
- Grade estimation was undertaken with ID3interpolation.
- Wenot wireframe constrained bulk density was determined from 48 site visit samples. Gilt wireframe constrained bulk density was determined from 28 site visit samples.
- Wenot gold process recoveries used were 90% for Alluvium/Saprolite and 92% for Transition/Fresh Rock. Gilt Creek gold process recovery used was 92%.
- The gold price used was US$2,500/oz.
- Wenot US$ open pit operating costs used were $2.50/t for mineralized material mining, $2.00/t for waste mining, $11/t for Alluvium/Saprolite processing, $18/t for Transition/Fresh Rock processing and $4/t G&A resulting in respective 0.20 and 0.30 g/t Au cut-off grades. Wenot and Gilt Creek US$ underground operating costs used were $85/t for mining, $18/t for processing and $7/t G&A resulting in a 1.5 g/t Au cut-off grade.
- Underground MRE blocks were reviewed for grade and geometric continuity. Isolated/orphaned and single block width strings of blocks were removed in order to only report Mineral Resources with a reasonable prospect of eventual economic extraction.
- Wenot pit slopes were 55o.
Wenot Deposit
This updated Mineral Resource Estimate for the Wenot shear-hosted deposit incorporates a total of 36 new diamond holes (23,597m), for a total of 639 drill holes incorporating 12,028 assay results within the MRE wireframes. Five drill holes have been completed on the Wenot deposit after the cut off date for the MRE, with assays pending, and these results will be included in a future MRE. Additional drilling on Wenot will commence very shortly aimed at further exploring the limits of the Wenot deposit, since it remains open in all directions. Some of this drilling will also start upgrading the large Inferred Mineral Resource to Indicated.
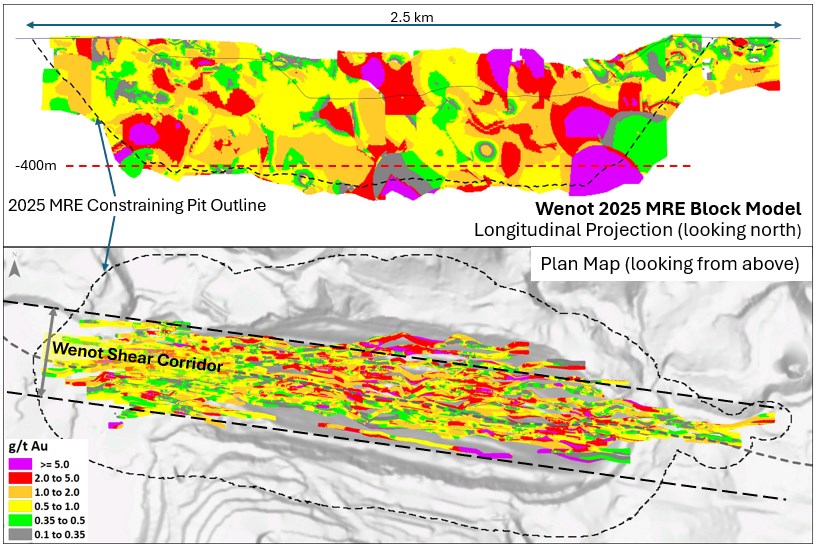
Figure 2. Wenot Deposit Block Model - 2a. Longitudinal Projection (W-E) and 2b. Plan View
To view an enhanced version of this graphic, please visit:
https://images.newsfilecorp.com/files/8712/263731_7c6565f1f490ebe2_002full.jpg
The impact of cut-off grade on the Wenot Mineral Resource Estimate size and grades is shown in Figure 3 below, with the full data provided in Table 3. The cut-off grade was lowered from 0.35 g/t Au in the 2024 MRE to 0.30 g/t Au in the current MRE. This change relates to an increase in the gold price assumption to $2,500/oz in the current MRE compared to $1,850/oz applied in February 2024. Operating cost increases were also included. A lowering of the cut-off grade assumes that lower grade gold can be economically extracted and processed in a higher gold price environment. The spot gold price has increased over 60% since the previous MRE in February 2024.
Applying a higher cut-off grade for more marginal projects can result in a profound decrease in the number of ounces in the Mineral Resource. Very significantly for Wenot, Figure 3 shows that by more than doubling the cut-off grade to 0.75 g/t Au, the number of ounces in the Indicated MRE is reduced only slightly to 845,000 oz, however at a higher grade 2.0 g/t Au. Further, the Inferred MRE at the same higher cut-off gives 3,286,000 ounces at a higher grade of 2.21 g/t Au. The overall impact is less than a 10% reduction in the number of ounces in the overall MRE however the grade of the Indicated MRE increases by 36% and the grade of the Inferred MRE increases by 24%.
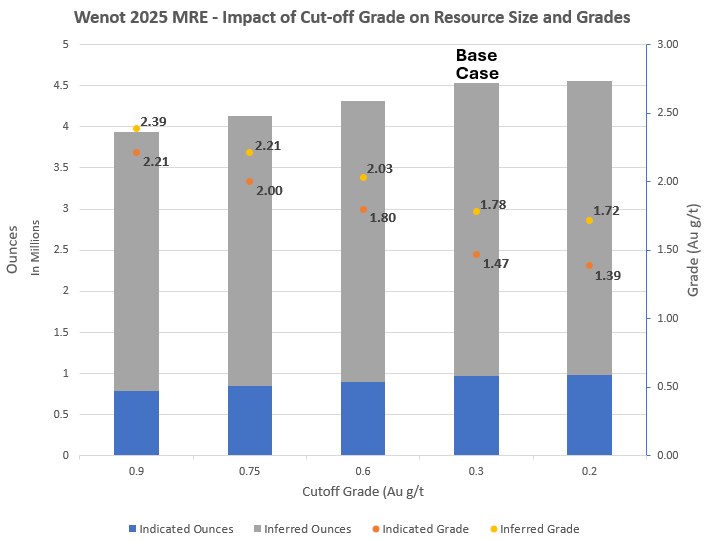
Figure 3. Chart Showing Impact of Cut-Off Grade on Wenot Pit-Constrained MRE Size and Grades (see Table 3)
To view an enhanced version of this graphic, please visit:
https://images.newsfilecorp.com/files/8712/263731_7c6565f1f490ebe2_003full.jpg
Gilt Creek Deposit
The Gilt Creek Deposit is hosted by the "Omai Stock", a quartz-diorite intrusive that is extensively mineralized with gold-bearing quartz vein stockworks hosted within broad sub-horizontal zones as well as with disseminated gold mineralization within the host intrusive rock (Figure 4). Two-thirds (2/3) of the Gilt Creek Deposit MRE are Indicated, mostly between 280 to 600m depth, due to higher drill density. The Indicated MRE stands at 1,151,000 ounces averaging 3.22 g/t Au, contained within 11.1Mt, using a 1.5 g/t Au cut-off. Historical mining of the uppermost 250m of the deposit from surface produced approximately 2.4 million ounces2.
There remains excellent potential for expansion of the Gilt Creek deposit at depth. The deepest holes drilled to date (to 967m below surface) still intersect significant gold mineralization, but with only a few, wide-spaced drill holes. Perhaps more importantly, the potential to expand the gold mineralized intrusive laterally, at the same depths as the current Gilt Creek MRE was demonstrated by the single drill hole (24ODD-095) completed on the Gilt Creek Deposit in 2024. The 1,185m long drill hole continued to intersect the gold-mineralized intrusion, 200m beyond the previously interpreted lateral extent.
Drill hole 24ODD-095 (1,185m) was completed on the Gilt Creek Deposit in late 2024. This drill hole was drilled mostly to support the design of an underground mine plan for the Gilt Creek Deposit, to be included in the upcoming PEA. The geotechnical data including RQD (Rock Quality Designation), natural and mechanical fracture counts, rock hardness and drill core recoveries are being used to estimate the competency of the rock which are important for the underground mine design. In addition, a downhole Televiewer system was used that provided visuals and detailed and accurate orientations on structures which are present in the rock mass. An additional drill hole (25ODD-122) is underway, drilling across the Gilt Creek Deposit and continuing in order to explore the down dip depth potential of the Wenot gold-bearing shear system. Results are pending.
No update has been done to the Mineral Resource Estimate as announced in February 2024, since one additional drill hole was not deemed material to the existing MRE. The Gilt Creek estimation methodology is detailed in the NI 43-101 Technical Report1 filed May 21, 2024 on www.sedarplus.ca. The Gilt Creek MRE incorporates 7,056 assay results from 46 diamond drill holes totalling 27,997 m within the mineralized wireframes. Figure 1 presents a 3-D model of the Wenot and Gilt Creek Deposits. Notes accompanying the 2024 MRE, shown below Table 2, summarize the economic and technical assumptions for the Gilt Creek Deposit, that include a gold price of US$1,850 per ounce and metallurgical recoveries of 92% (consistent with historical actuals).
The impact of cut-off grade on the Gilt Creek Mineral Resource Estimate size and grades is shown in Figure 4 below with details on Table 4. Increasing the cut-off grade from 1.5 g/t Au to 2.0 g/t Au increases the estimated average grade of both the Indicated and Inferred MRE by about 22% to 3.90 g/t Au (Indicated) and 4.14 g/t Au (Inferred), while reducing the estimated contained ounces by only 17% for both the Indicated and Inferred Mineral Resource, to 955,000 ounces and 552,000 ounces respectively.
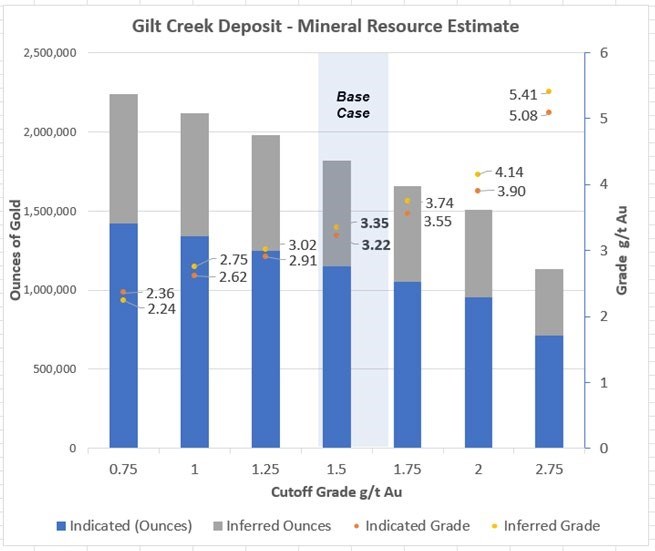
Figure 4. Chart Showing Impact of Cut-Off Grade on Gilt Creek MRE Size and Grades (data provided in Table 4)
To view an enhanced version of this graphic, please visit:
https://images.newsfilecorp.com/files/8712/263731_7c6565f1f490ebe2_004full.jpg
Preliminary Economic Assessment ("PEA")
A baseline PEA for Omai was completed in April 2024 and detailed in the NI43-101 Technical Report1 filed May 21, 2024. It included only a limited open pit operation for Wenot, with production of 1.84 million ounces of gold over a 13 year mine life, with an after-tax NPV5% of $556 million and an IRR of 20% at a $1,950/oz gold price. An updated PEA will incorporate th new, much-expanded Wenot MRE plus the adjacent Gilt Creek Deposit, not previously included. We expect a new mine plan to include a larger superpit for the Wenot Deposit with later stage underground mining to access the lower parts of the higher grade, wide "Dike Corridor" zones discovered during the recent Wenot drilling. A new mine plan is expected to include the concurrent development of a ramp from surface to access the Gilt Creek gold Deposit that starts at depths of approximately 280m, with the bulk of the current MRE between depths of 300m to 600m. Work on the updated PEA has commenced and it is expected to be completed in late 2025.
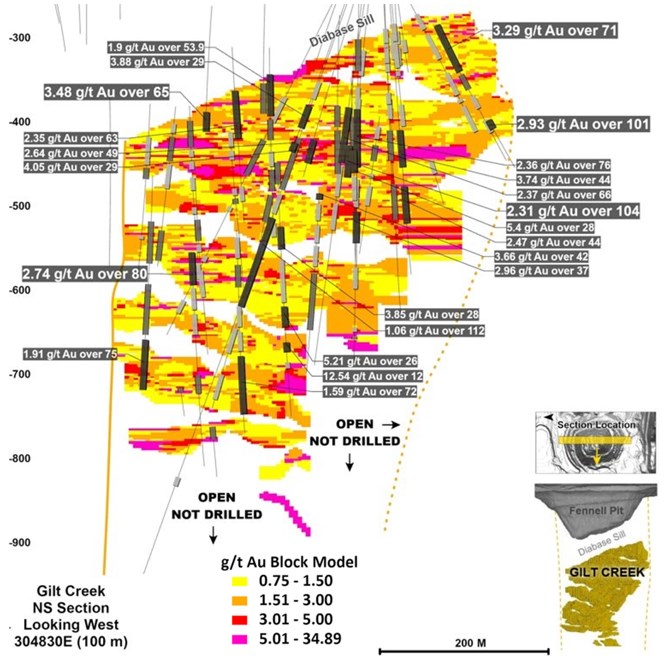
Figure 5. Cross-Section Projection of Gilt Creek Deposit (Omai Stock- Quartz Diorite Intrusion)
To view an enhanced version of this graphic, please visit:
https://images.newsfilecorp.com/files/8712/263731_7c6565f1f490ebe2_005full.jpg
As a corporate update, the Company also reports that David Stewart is no longer with the Company, and we wish him the best in his future endeavours.
1NI 43-101 Technical Report dated May 21, 2024 "UPDATED MINERAL RESOURCE ESTIMATE AND PRELIMINARY ECONOMIC ASSESSMENT OF THE OMAI GOLD PROPERTY, POTARO MINING DISTRICT NO.2, GUYANA" was prepared by Eugene Puritch, P.Eng., FEC, CET, President of P&E Mining Consultants Inc. is available on SEDAR+ and on the Company's website. It includes a Wenot Mineral Resource Estimate of 834,000 indicated ounces of gold averaging 1.48 g/t Au within 17.6 million tonnes and 1,614,000 Inferred ounces of gold averaging 1.99 g/t Au within 25.2 million tonnes, and the adjacent Gilt Creek Mineral Resource Estimate of 1,151,000 Indicated ounces of gold averaging 3.22 g/t Au within 11.1 million tonnes and 665,000 Inferred ounces of gold averaging 3.35 g/t Au within 6.2 million tonnes.
2 Past production at the Omai Mine (1993-2005) is summarized in several Cambior Inc. documents available on SEDARplus.ca, including March 31, 2006 AIF and news release August 3, 2006.
Quality Control
Omai maintains an internal QA/QC program to ensure sampling and analysis of all exploration work is conducted in accordance with best practices. Certified reference materials, blanks and duplicates are entered at regular intervals. Samples are sealed in plastic bags.
Drill core samples (halved-core) were shipped to ActLabs and some batches to MSALABS, both certified laboratories in Georgetown Guyana, respecting the best chain of custody practices. At the laboratory, samples are dried, crushed up to 80% passing 2 mm, riffle split (250 g), and pulverized to 95% passing 105 μm, including cleaner sand. Fifty grams of pulverized material is then fire assayed by atomic absorption spectrophotometry (AA). Initial assays with results above 3.0 ppm gold are re-assayed using a gravimetric finish. For samples with visible gold two separate 250g or 500g pulverized samples are prepared, with 50 grams of each fire assayed by atomic absorption spectrophotometry, with assays above 3.0 ppm gold being re-assayed using a gravimetric finish. Certified reference materials and blanks meet with QA/QC specifications.
Qualified Persons
Elaine Ellingham, MSc PGeo and Eugene Puritch, P.Eng., FEC, CET, President of P&E Mining Consultants Inc., both Qualified Persons (QPs) under National Instrument 43-101 "Standards of Disclosure for Mineral Projects", have approved the technical information contained in this news release. Ms. Ellingham is not considered to be independent for the purposes of National Instrument 43-101. Mr. Puritch is independent of Omai Gold Mines Corp.
About Omai Gold Corp.
Omai Gold Mines Corp. is a Canadian gold exploration and development company focused on rapidly expanding the two orogenic gold deposits at its 100%-owned Omai Gold Project in mining-friendly Guyana, South America. The Company has established the Omai Gold Project as one of the fastest growing and well-endowed gold camps in the prolific Guiana Shield greenstone belt. In February 2024 the Company announced an updated NI 43-101 Mineral Resource Estimate1 ("MRE") that is filed on www.sedarplus.ca. This was followed by an initial baseline Preliminary Economic Assessment ("PEA") in April 2024, which contemplated an open pit-only development scenario and included only 45% of the Omai Gold Project MRE. Subsequent to the 2024 MRE, the Company has been aggressively drilling to expand gold Mineral Resources at the Wenot Deposit and has identified additional wide zones of high-grade gold mineralization. The current news release announces an updated MRE and work has commenced towards an updated PEA for late 2025.
Omai Gold's plans for 2025 were to continue its impactful drill programs, announce an updated and expanded MRE (now done), and complete an updated PEA which would include an expanded Wenot open pit deposit and an underground mining scenario at Gilt Creek. The Omai Gold Mine produced over 3.7 million ounces of gold from 1993 to 20052, ceasing operations when gold was below US$400 per ounce. The Omai site benefits from much existing infrastructure and will soon be connected to the two largest cities in Guyana, Georgetown and Linden, via paved road.
For further information, please see our website www.omaigoldmines.com or contact:
Elaine Ellingham, P.Geo.
President & CEO
elaine@omaigoldmines.com
+1.416.473.5351
Neither the TSX Venture Exchange nor its Regulation Services Provider (as that term is defined in the policies of the TSX Venture Exchange) accepts responsibility for the adequacy or accuracy of this release.
Cautionary Note Regarding Forward-Looking Statements
This news release includes certain "forward-looking statements" under applicable Canadian securities legislation. Forward-looking statements include, but are not limited to, statements with respect to the timing of completion of the drill program, and the potential for the Omai Gold Project to allow Omai to build significant gold Mineral Resources at attractive grades, and forward-looking statements are necessarily based upon a number of estimates and assumptions that, while considered reasonable, are subject to known and unknown risks, uncertainties and other factors which may cause the actual results and future events to differ materially from those expressed or implied by such forward-looking statements. Such factors include, but are not limited to general business, economic, competitive, political and social uncertainties; delay or failure to receive regulatory approvals; the price of gold and copper; and the results of current exploration. Further, the Mineral Resource data set out in this news release are estimates, and no assurance can be given that the anticipated tonnages and grades will be achieved or that the indicated level of process recovery will be realized. There can be no assurance that forward-looking statements will prove to be accurate, as actual results and future events could differ materially from those anticipated in such statements. Accordingly, readers should not place undue reliance on forward-looking statements. The Company disclaims any intention or obligation to update or revise any forward-looking statements, whether as a result of new information, future events or otherwise, except as required by law.
Cautionary Note Regarding Mineral Resource Estimates
Until mineral deposits are actually mined and processed, Mineral Resources must be considered as estimates only. Mineral Resource Estimates that are not Mineral Reserves have not demonstrated economic viability. The estimation of Mineral Resources is inherently uncertain, involves subjective judgement about many relevant factors and may be materially affected by, among other things, environmental, permitting, legal, title, taxation, socio-political, marketing, or other relevant risks, uncertainties, contingencies and other factors described in the Company's public disclosure available on SEDAR+ at www.sedarplus.ca. The Inferred Mineral Resource in this estimate has a lower level of confidence than that applied to an Indicated Mineral Resource and must not be converted to a Mineral Reserve. It is reasonably expected that the majority of the Inferred Mineral Resource could be upgraded to an Indicated Mineral Resource with continued exploration. The accuracy of any Mineral Resource Estimates is a function of the quantity and quality of available data, and of the assumptions made and judgments used in engineering and geological interpretation, which may prove to be unreliable and depend, to a certain extent, upon the analysis of drilling results and statistical inferences that may ultimately prove to be inaccurate. Mineral Resource Estimates may have to be re-estimated based on, among other things: (i) fluctuations in mineral prices; (ii) results of drilling, and development; (iii) results of future test mining and other testing; (iv) metallurgical testing and other studies; (v) results of geological and structural modeling including block model design; (vi) proposed mining operations, including dilution; (vii) the evaluation of future mine plans subsequent to the date of any estimates; and (viii) the possible failure to receive required permits, licenses and other approvals. It cannot be assumed that all or any part of a "Inferred" or "Indicated" Mineral Resource Estimate will ever be upgraded to a higher category. The Mineral Resource Estimates disclosed in this news release were reported using Canadian Institute of Mining, Metallurgy and Petroleum Definition Standards for Mineral Resources and Mineral Reserves (the "CIM Standards") in accordance with National Instrument 43-101- Standards of Disclosure for Mineral Projects of the Canadian Securities Administrators ("NI 43-101").
Cautionary Statements to U.S. Readers
This news release uses the terms "Mineral Resource", "Indicated Mineral Resource" and "Inferred Mineral Resource" as defined in the CIM Standards in accordance with NI 43-101. While these terms are recognized and required by the Canadian Securities Administrators in accordance with Canadian securities laws, they may not be recognized by the United States Securities and Exchange Commission. The "Mineral Resource" Estimates and related information in this news release may not be comparable to similar information made public by U.S. companies subject to the reporting and disclosure requirements under the United States federal securities laws and the rules and regulations thereunder.
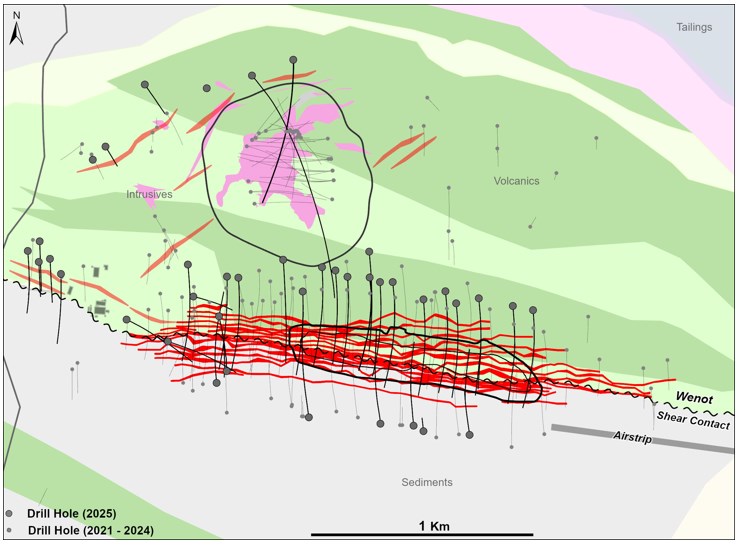
Figure 6. Geology Map of Omai Gold Property and Location of Gilt Creek and Wenot Deposits
To view an enhanced version of this graphic, please visit:
https://images.newsfilecorp.com/files/8712/263731_7c6565f1f490ebe2_006full.jpg
Table 3. Wenot Deposit - Impact of Cut-Off Grade on Mineral Resource Estimate
| Class | Cut-off | Volume | Density | Tonnage | AU | AU |
| Au g/t | m3 | t/m3 | kt | g/t | koz | |
| Indicated | 1 | 3,782,553 | 2.65 | 10,030 | 2.35 | 758 |
| 0.95 | 3,987,773 | 2.65 | 10,563 | 2.28 | 774 | |
| 0.90 | 4,217,255 | 2.65 | 11,159 | 2.21 | 792 | |
| 0.85 | 4,459,136 | 2.64 | 11,787 | 2.14 | 810 | |
| 0.80 | 4,720,005 | 2.64 | 12,458 | 2.07 | 828 | |
| 0.75 | 4,997,312 | 2.64 | 13,176 | 2.00 | 845 | |
| 0.70 | 5,287,242 | 2.63 | 13,925 | 1.93 | 863 | |
| 0.65 | 5,583,062 | 2.63 | 14,684 | 1.86 | 879 | |
| 0.60 | 5,893,551 | 2.63 | 15,478 | 1.80 | 895 | |
| 0.55 | 6,215,973 | 2.62 | 16,302 | 1.74 | 911 | |
| 0.50 | 6,530,493 | 2.62 | 17,116 | 1.68 | 924 | |
| 0.45 | 6,865,198 | 2.62 | 17,974 | 1.62 | 937 | |
| 0.40 | 7,204,974 | 2.62 | 18,843 | 1.57 | 949 | |
| 0.35 | 7,538,989 | 2.61 | 19,696 | 1.52 | 959 | |
| 0.30 | 7,863,808 | 2.61 | 20,520 | 1.47 | 968 | |
| 0.25 | 8,152,411 | 2.61 | 21,251 | 1.43 | 975 | |
| 0.20 | 8,431,079 | 2.60 | 21,950 | 1.39 | 980 | |
| 0.15 | 8,683,523 | 2.60 | 22,583 | 1.35 | 983 | |
| 0.10 | 8,909,220 | 2.60 | 23,156 | 1.32 | 986 | |
| 0 | 9,296,463 | 2.60 | 24,164 | 1.27 | 987 | |
| Inferred | 1 | 13,892,421 | 2.73 | 37,969 | 2.50 | 3,052 |
| 0.95 | 14,438,953 | 2.73 | 39,459 | 2.44 | 3,099 | |
| 0.90 | 15,001,471 | 2.73 | 40,989 | 2.39 | 3,145 | |
| 0.85 | 15,633,357 | 2.73 | 42,714 | 2.33 | 3,193 | |
| 0.80 | 16,249,590 | 2.73 | 44,395 | 2.27 | 3,238 | |
| 0.75 | 16,970,028 | 2.73 | 46,357 | 2.21 | 3,286 | |
| 0.70 | 17,645,241 | 2.73 | 48,192 | 2.15 | 3,329 | |
| 0.65 | 18,413,071 | 2.73 | 50,276 | 2.09 | 3,374 | |
| 0.60 | 19,177,141 | 2.73 | 52,346 | 2.03 | 3,416 | |
| 0.55 | 19,944,337 | 2.73 | 54,436 | 1.97 | 3,455 | |
| 0.50 | 20,642,547 | 2.73 | 56,342 | 1.92 | 3,487 | |
| 0.45 | 21,241,518 | 2.73 | 57,978 | 1.88 | 3,512 | |
| 0.40 | 21,811,514 | 2.73 | 59,534 | 1.85 | 3,533 | |
| 0.35 | 22,338,748 | 2.73 | 60,971 | 1.81 | 3,550 | |
| 0.30 | 22,821,012 | 2.73 | 62,277 | 1.78 | 3,564 | |
| 0.25 | 23,252,038 | 2.73 | 63,449 | 1.75 | 3,575 | |
| 0.20 | 23,689,080 | 2.73 | 64,642 | 1.72 | 3,583 | |
| 0.15 | 24,005,304 | 2.73 | 65,504 | 1.70 | 3,588 | |
| 0.10 | 24,263,024 | 2.73 | 66,209 | 1.69 | 3,591 | |
| 0 | 24,741,661 | 2.73 | 67,512 | 1.66 | 3,593 |
*fresh rock only, not including alluvium and saprolite that contain < 2% of the contained ounces
Table 4. Gilt Creek Deposit - Impact of Cut-Off Grade on Mineral Resource Estimate
| Class | Cut-off | Volume | Density | Tonnage | AU | AU |
| Au g/t | m3 | t/m3 | kt | g/t | koz | |
| Indicated | 5 | 489,235 | 2.74 | 1,341 | 8.52 | 367 |
| 4 | 750,615 | 2.74 | 2,057 | 7.10 | 470 | |
| 3 | 1,334,415 | 2.74 | 3,656 | 5.50 | 647 | |
| 2.75 | 1,588,895 | 2.74 | 4,354 | 5.08 | 711 | |
| 2.5 | 1,907,242 | 2.74 | 5,226 | 4.67 | 784 | |
| 2.25 | 2,296,734 | 2.74 | 6,293 | 4.28 | 866 | |
| 2 | 2,777,159 | 2.74 | 7,609 | 3.91 | 955 | |
| 1.75 | 3,371,592 | 2.74 | 9,238 | 3.55 | 1,053 | |
| 1.5 | 4,061,643 | 2.74 | 11,129 | 3.22 | 1,152 | |
| 1.25 | 4,873,240 | 2.74 | 13,353 | 2.91 | 1,250 | |
| 1 | 5,807,190 | 2.74 | 15,912 | 2.62 | 1,342 | |
| 0.75 | 6,830,125 | 2.74 | 18,715 | 2.36 | 1,421 | |
| 0 | 8,767,580 | 2.74 | 24,023 | 1.94 | 1,498 | |
| Inferred | 5 | 323,726 | 2.74 | 887 | 8.74 | 249 |
| 4 | 464,223 | 2.74 | 1,272 | 7.44 | 304 | |
| 3 | 782,570 | 2.74 | 2,144 | 5.81 | 401 | |
| 2.75 | 897,555 | 2.74 | 2,459 | 5.43 | 430 | |
| 2.5 | 1,059,352 | 2.74 | 2,903 | 5.00 | 467 | |
| 2.25 | 1,272,238 | 2.74 | 3,486 | 4.56 | 511 | |
| 2 | 1,529,285 | 2.74 | 4,190 | 4.15 | 559 | |
| 1.75 | 1,854,446 | 2.74 | 5,081 | 3.75 | 613 | |
| 1.5 | 2,288,174 | 2.74 | 6,270 | 3.35 | 675 | |
| 1.25 | 2,735,352 | 2.74 | 7,495 | 3.02 | 729 | |
| 1 | 3,190,785 | 2.74 | 8,743 | 2.75 | 774 | |
| 0.75 | 3,725,949 | 2.74 | 10,209 | 2.49 | 816 | |
| 0 | 4,237,144 | 2.74 | 11,610 | 2.24 | 837 |
![]()
To view the source version of this press release, please visit https://www.newsfilecorp.com/release/263731


