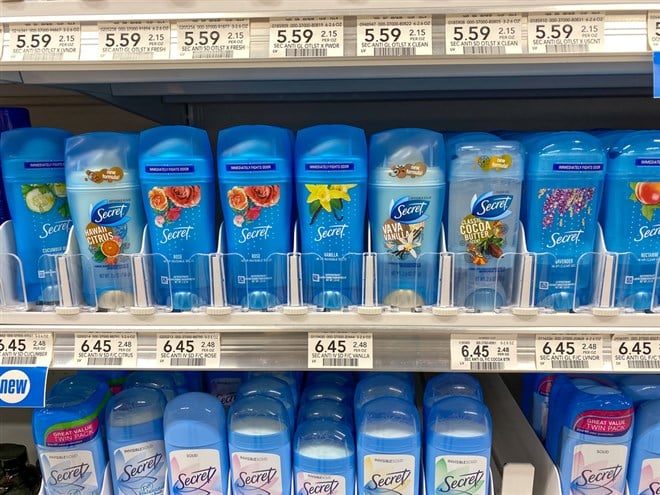
 The world’s largest consumer goods maker Proctor & Gamble (NYSE: PG) stock has fallen (-21%) for the year. Shares hit pandemic highs of $146.92 in November 2020 as consumers stockpiled its products before falling back down to $121.54 post-pandemic lows in March 2021. Ironically, post-pandemic frenzied buying drove shares up to a new high of $165.35 in January 2022 and it hasn’t looked back as it sold off to $122.18 lows. The maker of 65 popular household brands including Tide, Gain, Febreze, Mr. Clean, Oral-B, Crest, Bounty and Pampers distributes its products to over 170 countries. Recession fears tend to drive investors into defensive plays in the consumer staples sector with consistent dividend payouts. P&G is comprised of 10 product divisions ranging from Personal , Fabric, Home, Baby, Beauty, Hair, Skin and Grooming Care. Its largest customer is Walmart (NYSE: WMT). The Company has faced normalization after tough comparables last year.
Mitigating Inflation
Price hikes and operational efficiencies helped P&G mitigate some inflationary headwinds to improve its profit margins. Unfavorable foreign exchange took a (-6%) toll on net sales. The decline in the Russian market took a (-2%) to (-3%) decline in organic sales. Like consumer staples peers Clorox (NYSE: CLX), Unilever (NYSE: UL), Church & Dwight (NYSE: CHD) and Colgate-Palmolive (NYSE: CL), P&G also faces competition from generic and private label brands which consumers are flocking to. The Company plans to raise prices again in feminine, U.S. home and U.S. oral care products. The Company is growing organic sales in all 10 product categories. The U.S. saw a 5% rise in sales while China saw organic sales fall (-4%) due to COVID restrictions and lockdowns.
Beating Estimates Despite Headwinds
On Oct. 19, 2022, P&G released its fiscal first-quarter 2023 results for the quarter ending October 2022. The Company reported a profit of $1.57 per share beating consensus analyst estimates for $1.55 per share by $0.02. Revenues rose 1.3% year-over-year (YoY) to $20.61 billion beating consensus analyst estimates for $20.37 billion. P&G CEO Jon Moeller commented, “These results enable us to maintain our guidance ranges for organic sales and EPS growth for the fiscal year despite continued significant headwinds. We remain committed to our integrated strategies of a focused product portfolio, superiority, productivity, constructive disruption and an agile and accountable organization structure. These strategies have enabled us to build and sustain strong momentum. They remain the right strategies to navigate through the near-term challenges we’re facing and continue to deliver balanced growth and value creation.”
Lower Fiscal 2023 Outlook
P&G issued downside guidance for full-year 2023 EPS between $5.81 to $6.04 versus $5.83 consensus analyst estimates. Revenue are expected to fall (-3%) to (-1%) or $77.8 billion to $79.4 billion versus $79.97 billion analyst estimates. P&G expects adjusted free cash flow productivity of 90% with a $9 billion in dividends and plans to buyback between $6 billion to $8 billion.
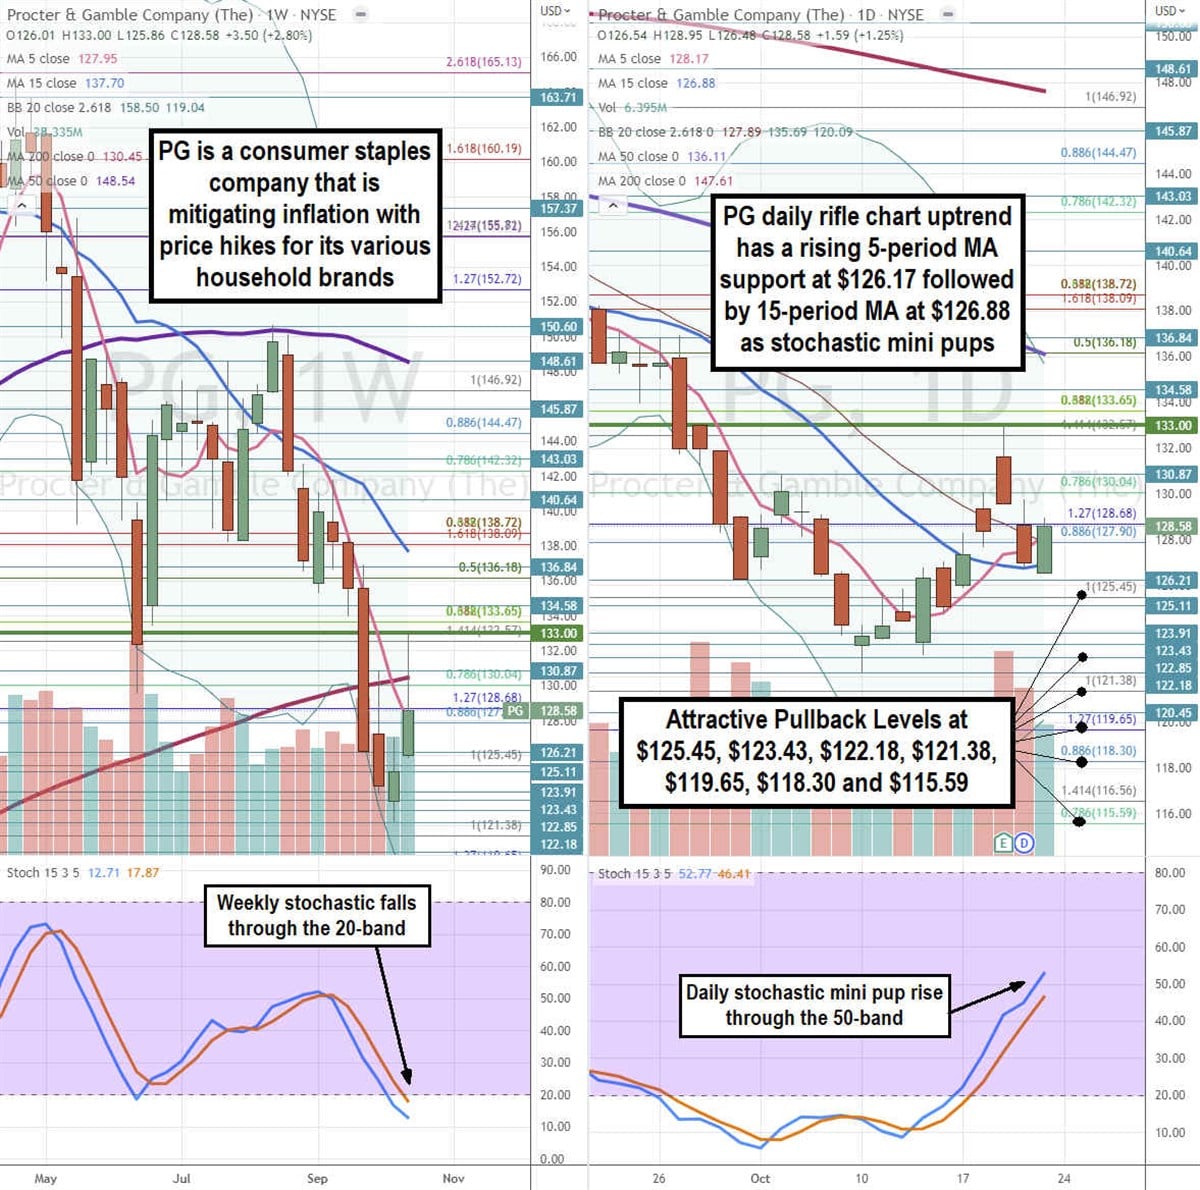
Here’s What the Chart Says
Using the rifle charts on weekly and daily charts can provide a near-term perspective of the playing field for PG stock. The weekly rifle chart downtrend was triggered on the $130.09 Fibonacci (fib) level breakdown. The weekly downtrend is led by the falling 5-period moving average (MA) at $127.95 followed by the 15-period MA at $137.70. Shares fell through the weekly market structure low (MSL) buy trigger at $133.00 and weekly 200-period MA support at $127.95. The weekly lower Bollinger Bands (BBs) sit at $119.04. The weekly stochastic has fallen through the 20-band. The daily rifle chart has an uptrend with a rising 5-period MA followed by the 15-period MA support at $126.88. The daily stochastic formed a bullish mini pup as it rises through the 50-band. The daily 50-period MA at $136.11 nearly overlapping the daily upper BBs at $135.69. Attractive pullback levels sit at the $125.45 fib, $123.43, $122.18, $121.38 fib, $119.65 fib, $118.30 fib, and $115.59 fib level.