The Cigna Group (CI), headquartered in Bloomfield, Connecticut, provides insurance and related products and services. Valued at $79 billion by market cap, the company offers life, accident, disability, supplemental, medicare, and dental insurance products and services.
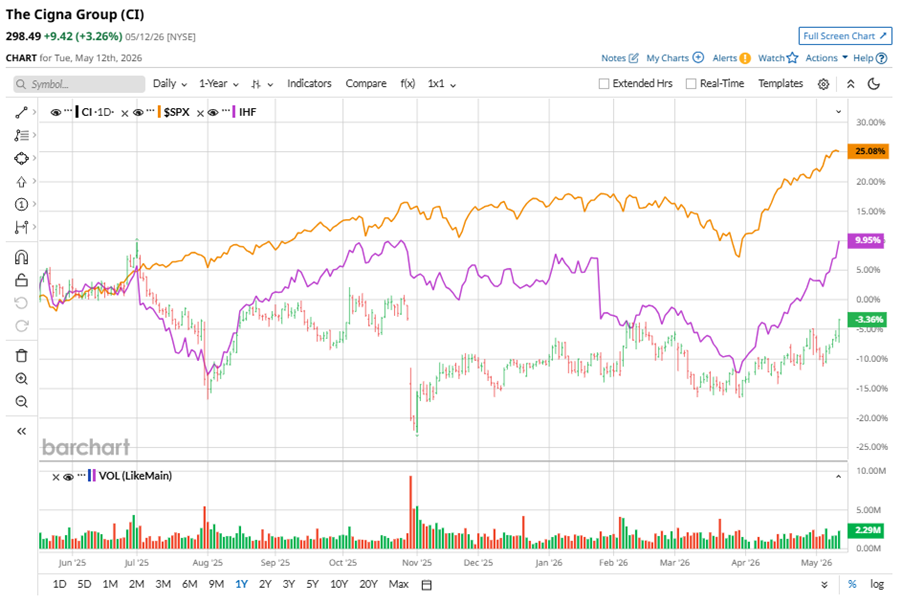
Shares of this healthcare insurance giant have underperformed the broader market over the past year. CI has declined 5.5% over this time frame, while the broader S&P 500 Index ($SPX) has rallied nearly 26.6%. However, in 2026, CI’s stock rose 8.5%, surpassing the SPX’s 8.1% rise on a YTD basis.
Narrowing the focus, CI’s underperformance is also apparent compared to the iShares U.S. Healthcare Providers ETF (IHF). The exchange-traded fund has gained about 2.8% over the past year. However, CI’s returns on a YTD basis outshine the ETF’s 7.2% gains over the same time frame.
On Apr. 30, CI shares closed down marginally after reporting its Q1 results. Its adjusted EPS of $7.79 exceeded Wall Street expectations of $7.62. The company’s adjusted revenue was $68.5 billion, surpassing Wall Street forecasts of $66.7 billion.
For the current fiscal year, ending in December, analysts expect CI’s EPS to grow 1.8% to $30.39 on a diluted basis. The company’s earnings surprise history is impressive. It beat the consensus estimate in each of the last four quarters.
Among the 23 analysts covering CI stock, the consensus is a “Strong Buy.” That’s based on 18 “Strong Buy” ratings, two “Moderate Buys,” and three “Holds.”
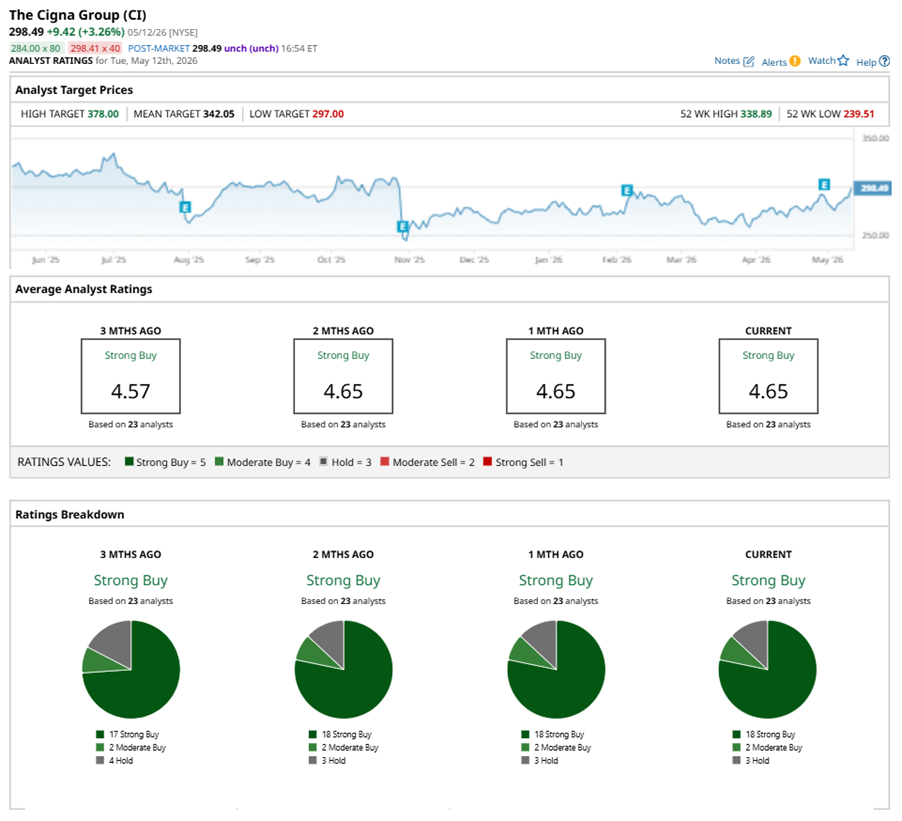
This configuration is more bullish than three months ago, with 17 analysts suggesting a “Strong Buy.”
On May 5, David S Macdonald from Truist Financial Corporation (TFC) reiterated a “Buy” rating on CI, with a price target of $350, implying a potential upside of 17.3% from current levels.
The mean price target of $342.05 represents a 14.6% premium to CI’s current price levels. The Street-high price target of $378 suggests an upside potential of 26.6%.
On the date of publication, Neha Panjwani did not have (either directly or indirectly) positions in any of the securities mentioned in this article. All information and data in this article is solely for informational purposes. For more information please view the Barchart Disclosure Policy here.
More news from Barchart