Anheuser-Busch InBev S.A. ADR (NYSE: BUD) operates as a holding company, which engages in the manufacture and distribution of alcoholic and non-alcoholic beverages. It operates through the following geographical segments: North America, Latin America West, Latin America North, Latin America South, EMEA, Asia Pacific and Global Export and Holding Companies...
Take a look at the 1-year chart America (NYSE: BUD) below with my added notations...
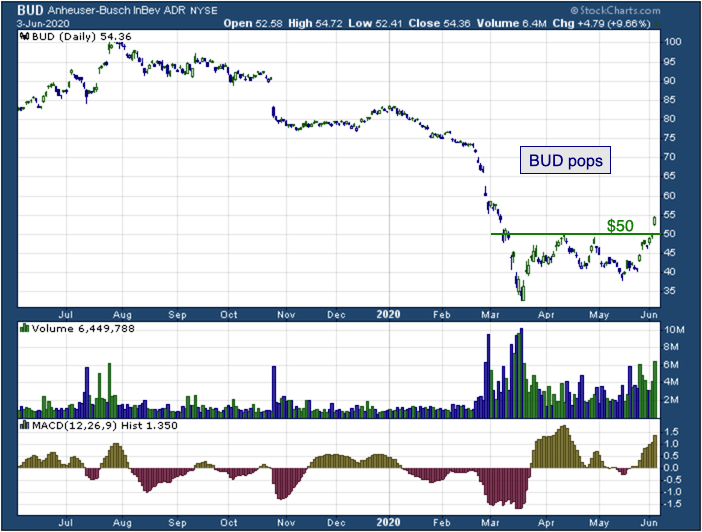
BUD had formed a key level of resistance at the $50 level (green) during the past two to three months. However, the stock broke through that resistance yesterday. If BUD comes back down to that $50 level, which should now act as support, a bounce could be expected.
The Tale of the Tape: BUD broke through its key level of resistance at $50. A long trade could be entered on a pull back down to that level. However, a break back below $50 could negate the forecast for a higher move and would be an opportunity to get short the stock.
Before making any trading decision, decide which side of the trade you believe gives you the highest probability of success. Do you prefer the short side of the market, long side, or do you want to be in the market at all? If you haven’t thought about it, review the overall indices themselves. For example, take a look at the S&P 500. Is it trending higher or lower? Has it recently broken through a key resistance or support level? Making these decisions ahead of time will help you decide which side of the trade you believe gives you the best opportunities.
No matter what your strategy or when you decide to enter, always remember to use protective stops and you’ll be around for the next trade. Capital preservation is always key!
Good luck!
Christian Tharp, CMT
@cmtstockcoach
Don’t forget to join our LinkedIn group by clicking the link below to get free trade ideas, updates and commentary: Stock Trading & Investing for Everyone
Want More Great Investing Ideas?
9 “BUY THE DIP” Growth Stocks for 2020
What If I Am Wrong About the Bear Market? Even stubborn bears need to contemplate why the market continues to rally above 3,000.
7 “Safe-Haven” Dividend Stocks for Turbulent Times
BUD shares were trading at $55.41 per share on Thursday morning, up $1.05 (+1.93%). Year-to-date, BUD has declined -32.46%, versus a -2.32% rise in the benchmark S&P 500 index during the same period.
About the Author: Christian Tharp
 The post Chart of the Day: Anheuser-Busch InBev (BUD) appeared first on StockNews.com